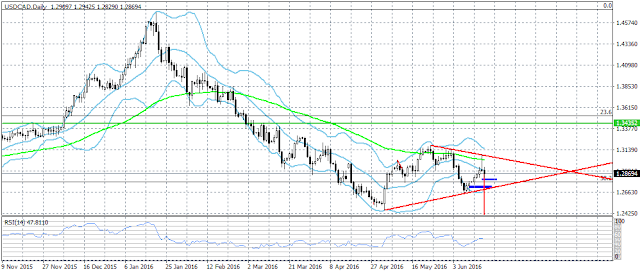
Although USD/CAD rallied it could not reach the target at 1.3130 as I thought it would, it could not even reach 1.3100, as it stopped 15 pips below that level and started a sharp move to the downside.
This move to the downside formed a great doji candlestick that closed below the middle line of the Bollinger Bands indicator on the daily time frame.
Today the pair continued falling, reaching a low at 1.2829.
I think that the pair will continue falling and the two closest support zones it could reach are the one between 1.2810 - 1.2790, and the one between 1.2730 – 1.2700, as you can see on the screenshot.
Above all else, however, we need to see how the daily candlestick will close today. If the candlestick closes below 1.2861, the possibility to see a further move down next week increases immensely. The alternate scenario is that there will be a retracement to the upside before the pair continues falling.


Good analysis. Very good explanations.
ReplyDeleteGood analysis!
ReplyDeleteGood to know.
ReplyDeleteGood insight.
ReplyDeleteGood post!
ReplyDeleteI agree with your analysis.
ReplyDeleteThanks for the analysis.
ReplyDeleteWell spotted! Thanks for sharing it.
ReplyDelete