Thursday, May 31, 2018

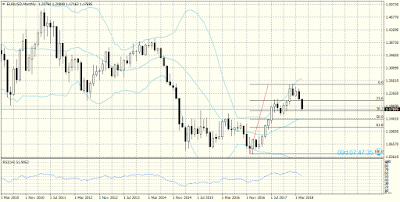
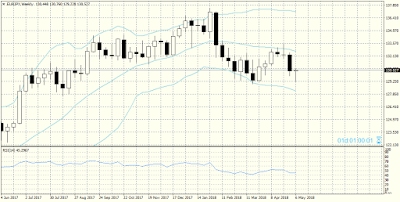
I Expect A Corrective EUR/AUD Move North

The pair has been developing a downward trend since 25th April 2018, and for a little over a month it depreciated with almost 700 pips. For the past two weeks (in the second half of the depreciation) the movement was within a perfectly formed trend channel.

On the D1 time frame we can see that the price has moved outside the channel and two already closed bars – a doji and a spinning top – are the first signals for a possible correction to the upside.


On the H4 time frame there is a RSI divergence which is the next signal for the beginning of a possible correction.

This is my reasoning for the expected correction.
If the pair reaches the limit of the divergence it should rally to 1.5650-1.5680.


Wednesday, May 30, 2018

The AUD/USD Correction Continues, The Test Of The Trend Line Remains A Valid Target


For the past few days AUD/USD behaved exactly as I expected>>>  – it dropped and tested the support zone at 0.7500 – 0.7520, with the pair depreciating to 0.74759.

Today the rally north was very sharp: for a single day the pair rose from 0.74759 to 0.75750 (at the moment the rally is exactly 100 pips). In my opinion this is not the entirety of the rally – the test of the breakout of the flag on the W1 time frame is still a valid target.

There is a little over a day left until the bar on the monthly time frame closes, but judging by its shape we could make an educated guess how much the pair will rise. In my opinion, the closest target for the moment is 0.7600, followed by 0.7670, but we could witness a rally to 0.7720 – 0.7750.


Tuesday, May 29, 2018

SmartTemplate: An ActivTrades Trading Tool


The leading independent Forex broker invites you to expand the functionality of your Metatrader 4 trading platform by using its excellent add-on SmartTemplate.
SmartTemplate is an extensive indicator tool that aids traders in making calculated trading decisions.

Unlike most indicators on the market, the new SmartTemplate offers simple but highly effective features.
The indicator does not use complex mathematical formulas, it rather indicates unique long and short trading opportunities based on chart signals and puts them in context with the respective trend strength.
It both provides explicit bar chart signals and defines the clear time frame to trade.

For more information about SmartTemplate and to request it follow this link.>>>


Friday, May 25, 2018

The AUD/USD Correction May Continue With A Depreciation To 0.7500


There is almost no doubt that before the pair tests the breakout of the trend line it will head for the support at 0.7450.

On the H1 time frame we can notice an almost perfectly formed flag – the pair has reached the support and resistance trend lines twice, has broken out below it and we can hope that the next strong support on the way down would be at 0.7500 – 0.7520.


That could be the entirety of the depreciation and then there could be a test of the breakout  (marked by a thick red line) or the pair could test the local low in the zone around 0.7440 – 0.7420 and then to begin a rally toward 0.7640 – 0.7750.

Today is Friday and the trading week will conclude in mere hours, so it is important to see how the W1 bar will close. It could add more clarity regarding how the pair will develop next week.


Thursday, May 24, 2018

AUD/USD Is Developing A Sideways Consolidation


AUD/USD reached without a problem the resistance at 0.7600 and without making any attempts to break out above it and continue rallying it began developing a sideways consolidation which is especially visible on the H4 time frame.

What I can see on that time frame makes me think that before the pair continues moving north to test the trend line breakout, it could test the diagonal support (in red) or even fall lower and test the support at 0.7450.

For the moment the pair is forming a barbed wire pattern on the H4 time frame and the possibility to continue to 0.7500 is increasing.

The alternate scenario is for a test of 0.7600 and a rally to 0.7660 after a possible breakout.


Wednesday, May 23, 2018

NZD/CAD May Begin Rallying


On the H4 time frame there is a trend channel that the pair has broken out above (in dark blue), after which the rally reached the channel’s limit (which was 87 pips).

Then the pair developed a downward wedge (in red) and broke out above it.

The two figures together form a head and shoulders pattern.

Although the pair continues testing the breakout, I think that in the medium term it will continue developing to the upside. The limit of the wedge it broke out above is 64 pips, and if it reaches it we should see a rally to 0.8950.


That means that there will be a breakout of the head and shoulders figure and then a rally to the 38.2%, 50% and 62.8% Fibo of the entire depreciation from 0.95147 (14th  March 2018) to 0.87855 (17th May 2018).


And as a last argument in favour of the expected rally I’d point out the pin bar on the W1 time frame, which has closed above the support at 0.8830.


Tuesday, May 22, 2018

I Expect A NZD/USD Rally

On the W1 and the Daily time frame the pair reached a local support at 0.6850 and after breaking out above the trend channel that it formed from 1st May 2018 to 15th May 2018 (on the H4 time frame, marked in red) it began an movement to the upside.

I expect the pair will test the support at 0.6850 once more after which it may begin a move north to 0.7050 – 0.7060 (which is 38.2% Fibo of the last depreciation from 0.73947 to 0.68506).

To the upside after the resistance at 0.7950 – 0.7060 follows the strong resistance at 61.8% Fibo in the zone around 0.7150 – 0.7170.

To the downside the next strong support is around 0.6800 – 0.6780.

Monday, May 21, 2018

I Expect An EUR/USD Correction, After Which The Pair Will Continue Its Downward Trend


The market decided that there will be a breakout below the triangle it developed at the high of the EUR/USD movement and the limit of that triangle was reached and even exceeded as the pair depreciated with over 500 pips.

The current trend is bearish without a doubt and is developing as a correction of the impulse rally from 1.03400 to 1.25556. The strong support would be at 50% Fibo of the impulse, in the zone around 1.1450 - 1.1400.


Despite that there is quite a while until the pair reaches that level and we are currently focused on the D1 support level reached by the pair at 1.1700. The signal for a move north formed when the H4 bar closed at 1.17163. The closing of the D1 bar after a low at 1.17163 (at 38.2% Fibo)  would confirm the expected corrective move to the upside.


I expect the correction to reach 1.1950 – 1.1970 after which the depreciation to the strong support at 1.1450 – 1.1400 will be renewed.


Saturday, May 19, 2018

GBP/USD Is Developing A Bearish Trend With Initial Target 1.3050 – 1.3000


After the breakout below the trend channel GBP/USD continued depreciating, I think the strong support level will be around 1.3350 – 1.3330.


I expect that the pair will rebound from that level back to the trend line it broke out below (in red).
For the moment, however, the main trend remains bearish and in the medium term we could expect that after the test of the breakout the pair will renew its depreciation toward 1.3100 – 1.3050. If the support holds out we may see a renewal of the upward movement.

In the alternative scenario there will be a breakout below that support and in the long term the pair will test the lowest levels it reached in the beginning of 2017.


USD/JPY Is Headed For The Resistance Trend Line Of The Channel


The expected rally of the USD/JPY pair became a reality, and said rally turned out considerably stronger than what was expected initially.

If we examine the W1 time frame we cannot fail to notice that what the pair is forming strongly resembles a flag and the pair has reached its trend lines four times – twice the resistance and twice the support trend line. The figure, however, is rather deep so I’d rather not actually call it a flag.

It appears that the pair is headed for the resistance trend line for a third time. It is possible to form a correction to 108.00 before it tests the resistance.

In the alternative scenario the pair will continue directly to the resistance trend line.

The more interesting question is, I think, whether the pair will break out above the resistance trend line. If that happens, we could expect a serious continuation of the upward movement. The height of the channel at its base is 1000 pips, but whether the pair could reach that limit is another matter, which is up for the market to decide.

Thursday, May 17, 2018

AUD/USD Is Developing A Bearish Correction

The expected bearish correction began, but as most corrections on the W1 and D1 time frames, it is very slow to develop and it will take time to end.

The pair reached the local low at 0.74121 crowned by a pin bar on the D1 and H4 time frames, and began a movement that so far looks like a wide consolidation.


A trend channel is developing on the D1 time frame, and the next resistance level is in the zone around 0.7580 -0.7600, but in my opinion the expectation that the correction will reach 0.7640 – 0.7650 remains valid.

After reaching that resistance level we could expect for the depreciation to continue while the strong support would be around 0.7230 – 0.7220.


Tuesday, May 15, 2018

The ActivTrades Market Analysis


Forex trading can sometimes be a somewhat lonely occupation and there is nothing better than being able to go through the analysis and assessment of various financial instruments and news events done by seasoned experts.

The leading online broker ActivTrades invites you to read the latest opinions and commentaries of such experts in order to keep ahead in the markets. Begin your trading day with the various technical insights into the global financial sector and use what you have read to your great advantage as you trade!

Here you can read the ActivTrades Market Analysis.>>>


Monday, May 14, 2018

I Expect A Bullish GBP/USD Correction


GBP/USD broke out below the trend line of the upward channel that formed from 1.19914 - 1.43762 and the main trend is bearish for the moment.

Despite that the pair reached a strong support at 1.3420 on the W1 time frame and the bar that formed above that support is a signal for a possible bullish correction.


On the D1 time frame there are bars which confirm the expectation for a corrective rally. The priority scenario is here is for a rally for the pair to test the breakout – i.e. a rally to 1.3720 – 1.3750, after which we could expect a renewal of the downward movement to 1.3200 – 1.3150.

The alternative scenario is for a direct depreciation toward 1.3200 – 1.3150 but at the moment that appears less probable.


Saturday, May 12, 2018

The EUR/JPY Double Bottom Is A Signal For A Possible Rally


The double bottom can be seen on the D1 time frame (128.944 on 22nd March 2018 and 129.28 on 22nd May 2018).

Apart from that the last weekly candle is a pin bar, which confirms the scenario for a rally of this pair.

If this is a valid scenario, we could expect a move north to the first resistance at 131.50, followed by another rally to 132.50. If the pair breaks out above those resistance levels, we could expect a move up to 133.50.

Under any circumstances, however, this will be a corrective rally. To the downside there is a strong support around 127.00 and I think the pair will reach it once it’s done with the possible correction to the upside.


Friday, May 11, 2018

The Expectation For An AUD/JPY Rally To 84.80 - 85.00 Remains Valid


The AUD/JPY movement did not develop exactly as I expected >>>

Instead of beginning a rally toward the resistance trend line of the channel the pair broke out below it as it depreciated and reached its limit.

Right after that the upward movement was renewed. On the H4 time frame the pair appears to be attempting to form head and shoulders figure which would be a signal for a reversal, but so far that is not confirmed.

My expectation for a rally to 84.80 - 85.00 still remains valid.

Today is Friday and there are mere hours left until the end of the trading week. On the W1 time frame a bar is being formed that has not closed yet, but soon it will be clear how it will close. For now there’s a chance for it to close as a pin bar and if that happens that would be the first stable signal for a renewal of the rally to 84.80 - 85.00.


Thursday, May 10, 2018

The USD/CAD Depreciation Began

The longer the time frame is, the larger the movement after a signal is, but also the longer one has to wait for that movement to begin.

This is exactly what happened on the USD/CAD charts, after at the end of last month the pair formed a signal consisting of two monthly bars: a shooting star and a hanging man, which warned for an impending depreciation>>> .

Before said depreciation began the pair once more tested the resistance at 1.30 and at 1.29972.
The first strong support on the way down is at 1.2650, but in my opinion the bearish trend will continue until the pair reaches the potential trend line of the channel (in blue) that is forming on the chart. And that means another 300 – 320 pips drop.

Once we see the way the pair develops when it reaches the support trend line we may be able to analyze its further movement.


Wednesday, May 09, 2018

AUD/USD May Begin A Corrective Rally Before It Tests The Support At 0.7240


That is the logical conclusion if we examine the D1 time frame.

During its move to the downside the pair has formed a bearish channel and has reached its trend lines (in red) four time times, forming five waves on the way down from 0.81356 to 0.74121.

The last wave of the depreciation is from 0.78125 to 0.74121, which is exactly 400 pips without a correction.


What is more, on the H4 time frame there is a RSI divergence, and if the pair reaches its limit it should reach 0.7650 – 0.7670. That would mean it would test the breakout of the pennant (in blue).
After a correction we can expect a depreciation toward the next strong support at 0.7240.

In my opinion, the rally will be obligatory, but it is still a good idea to wait for a confirmation signal before we open any long positions.

Monday, May 07, 2018

AUD/USD Continues Testing The Support At 0.7460 – 0.7500


AUD/USD formed a correction of about 100 pips north, from 1.74725 to 1.75603, after which it renewed its depreciation toward the support zone around 0.7460 – 0.7500 (in grey).

I think there are two scenarios for further development in this zone:

 In the first scenario the pair will test the support one more time, after which it will begin the true correction to the upside, which should lead it to a test of the support trend line of the pennant it broke out below (in red) – around 0.7650

In this case after the test of that trend line the depreciation should be renewed – the limit of the pennant is 1000 pips in the long term.

The second scenario is for a breakout below the support zone and a continuation of the depreciation.
In both scenarios we should be patient before opening new positions, the intentions of the big players on the market are unclear and we should wait until there is some clarity.


Saturday, May 05, 2018

I Expect A USD/CHF Drop


When the NFP data came out on Friday the USD showed strength and moved north.

In my opinion, however, that was a temporary reaction and next week we will see a weaker dollar.

USD/CHF, despite the visibly exhausted bullish trend and the obvious need for a correction, moved north with about 40 during the news event , reaching a new high at 1.00225.

On the W1 time frame the pair is at a strong resistance and despite the minimal rally next week I expect there will be a bearish correction. In my option, the depreciation may reach 0.9570 – 0.9550.

The possibility for a correction is also confirmed by the RSI divergence on the H4 time frame, which is between four highs and is a signal for a trend reversal.

Thursday, May 03, 2018

I Expect An AUD/JPY Rally


The AUD/JPY pair is at a strong support in the zone around 82.30 – 81.90. That can be clearly observed on the H4 and D1 time frames.


At the same time the pair is also clearly forming a trend channel on the H4 time frame (in red) and it has reached the support trend line twice and resistance trend line once. I expect that there will be a rally to the resistance trend line around 83.30-83.50.

I think that in case the pair breaks out above that resistance trend line we could expect the rally to continue toward 84.80 – 85.00.

Should that scenario fail we could expect a depreciation of the pair to test the support at 80.50.


Wednesday, May 02, 2018

A Falling Star And A Hanging Man – This Powerful Bar Combination Is A Signal For A USD/CAD Trend Reversal From A Bullish Into Bearish One


That exact bar combination appeared on the monthly time frame of the USD/CAD pair and it has formed right below the strong resistance at 1.2990 – 1.3000 (marked by the middle line of the Bollinger Bands indicator).

We can expect quite confidently that a bearish trend is about to begin and it is possible for it to last several months (every signal is supposed to be traded on the time frame it appeared, and the longer term that time frame is, the longer term that movement will be).

On the W1 time frame the pair is developing in a consolidation channel with about 800 pips width and it appears that it is time for the subwave C from the correction to the downside (in green) to begin.

On the D1 time frame there is a barbed wire pattern of seven bars that have already closed below the resistance at 1.2290, which confirms that expectation.

I think the first long term target is around 1.2650 and after the pair overcomes that support we can expect another depreciation to the lower band of the Bollinger Bands indicator on the monthly time frame.