Friday, April 29, 2016

EUR/USD Is Testing the Resistance at 1.1450 Again


The pair has been testing this level again and again for four weeks now as you can see on the daily time frame, which makes me think that eventually it will succeed in breaking above that resistance.


In case it does break above the resistance the pair will continue rising towards 1.1530 - 1.1550, which is visualized by the green line of (EMA)89 on the weekly time frame. Of course, that is unlikely to happen today, since today is Friday and the market will close soon.


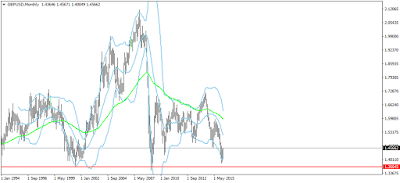
I am also considering one other thing – on the monthly time frame there is a visible possibility that the pair might rise to 1.2400, and why not even higher than that? Which begs the question - is the bearish trend that has lasted for two years now over? The market, of course, is the only thing that can answer that question.


Thursday, April 28, 2016

BoJ Decided Not to Expand Its Monetary Policy and GBP/JPY Fell with 550 Pips


The same thing happened with the other major JPY pairs – USD/JPY and EUR/JPY.

This announcement had a very impressive effect on the market.

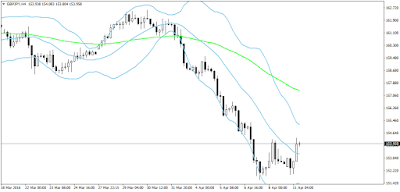
However, since I am always very interested in interpreting the signals I see on the charts, I’d like to say that on the GBP/JPY daily time frame the pair had reached a very strong level of resistance at 162.80, which is visualized by the blue line of the Bollinger Bands indicator and the green line of (EMA)89. What is more, below that resistance level there are two doji candlesticks which are an obvious signal that the pair is ready for a reversal.

The same type of signals can be seen on the daily and shorter time frames of the other JPY pair charts.

I am saying this because I have always been convinced that the fundamentals, which are undoubtedly the engine and catalyst of the movement of the different currency pairs, inevitably have their reflection on the charts. That is why it is very important to me to be able to interpret what the market wishes to tell us through them. Thus we always have to strive to become better and better in our ability to read them.


Wednesday, April 27, 2016

EUR/GBP Almost Reached the Strong Resistance at the Diagonal Trendline and Started Falling


About three weeks ago I wrote about my expectations about this pair. The situation here has been developing very logically, the only difference being that I thought that the pair might rise with another 100 pips, but that didn’t happen. Rather than move a little higher, so it can touch the diagonal trendline, it started falling immediately and has been falling continuously for three weeks now.


As I am examining the monthly time frame I keep thinking that the almost 400 drop is just the beginning. On the other hand, on the smaller time frames (like the daily and the weekly ones) you can see that EUR/GBP has reached a serious support level at 0.7750 which is visualized by the green line of the (EMA)89 on the daily time frame and the middle line of the Bollinger Bands indicator on the weekly time frame. The support will inevitably slow the move to the downside and it is possible it will temporary bounce off of it.

If the pair manages to break below the support on the weekly time frame, it will probably continue falling towards the next support level at 0.7580 (the green line of EMA89). The next support below that one is 0.7450, which is the middle line of Bollinger Bands on the monthly time frame.

Tuesday, April 26, 2016

GBP/USD Is Rising


After the pair almost reached a historical low on 29th January 2016, which has only been reached three times in the past twenty years, the pound bounced off the support at 1.38350 and started rising again.


As you can see on the weekly time frame, the pair broke above the resistance at 1.44 visualized by the middle line of the Bollinger Bands indicator with ease and started rallying towards the next resistance level at 1.49.

It is still difficult to predict what the pound will do – whether it will continue rising towards 1.50 or the range will start again, so it can test the previously reached low. For the moment the trend is obviously bullish and it is a good idea to look for suitable entries for long positions on the smaller time frames.


After 40 Hours of Tight Range USD/CAD Fell Again


People’s expectation were that there would be a correction to the upside after the last drop, but nothing of the sort has happened so far. After over 44 hours of a tight range when the London session opened today the pair fell with over 50 pips, retracing the small move to the upside that had been going on for the past 5 days, as you can see for yourselves on the daily time frame.


If the pair does break below the support at 1.2630, which can be seen on the 4-hour time frame,  USD/CAD could start falling towards the next significant support level around 1.2500, visualized by the lower band of the Bollinger Bands indicator on the daily time frame.

In the alternate scenario the pair will bounce off the aforementioned support and it will continue climbing towards resistance trend line (the red line), after which it will start falling again.

At this point a deep corrective movement to the upside, however, seems less and less likely to me.


Friday, April 22, 2016

USD/CAD Reached the Support at 1.2650 a Correction Began


 1.2650 is a very strong level of support, which I have mentioned several times in this blog so far. That support level is really quite obvious on the monthly time frame.


The pair reached that support, even managed to fall lower than it, but it quickly rebounded and began yet another corrective movement.

The RSI indicator on the daily time frame also suggested that there would be such a movement, since you can notice a strong divergence that has been forming on it since the beginning of March.

At the moment the pair is in the middle of the trend channel, which is quite obvious on the daily time frame. I expect that the move to the upside will continue until the resistance line of said trend channel, where it should bounce off of it and continue towards the support line.

Also, considering the fact that today is Friday and the market will close later today, I expect that the major move to the upside will happen next week.


Thursday, April 21, 2016

CAD/JPY Could Not Break Above 87.00 Yet Again


After it succeeded in breaking above the resistance zone around the middle line of Bollinger Bands and (EMA)89 indicators on the daily time frame around 85.30 and continued rising, yesterday the pair reached the strong resistance level on the same time frame at 87.00, visualized on the screenshot with the red horizontal line, but it failed to break above it.

CAD/JPY continued testing it in vain for almost 20 hours and eventually the pair started falling.

I think it is quite possible for the pair to continue falling towards 85.00, which would now be a level of support, rather than resistance.

If it does remain above that level, I think we will likely see it test 87.00 again. The alternate scenario is to break below 85.00 and continue falling towards the next support at 82.30 – 82.00, which is visualized by the lower band of Bollinger Bands on the daily time frame.


Wednesday, April 20, 2016

USD/JPY May Have Begun a Correction


The pair has reached a very serious level of support at 109.50, visualized by the lower band of Bollinger Bands on the montly time frame. It was logical that the pair would not be able to break below that support right away.


On the weekly time frame there is a doji candlestick, which can be interpreted as a signal that the pair may have ended its move to the downside for now. This is one of the largest time frames, so its also logical to conclude that the correction that will follow will likely be quite deep.


On the daily time frame there is also a double bottom after which the pair started rising.

The first level of resistance is at 109.80, and if the pair succeeds in breaking above it, it will continue climbing towards 112.00. A breakout above that level could lead to a further rally towards 114.80.

Still, we shouldn’t forget that the main trend is bearish and it remains to be seen how high the pair will climb before it continues on its way down to 104.00 which is a very strong support visualized by (EMA)89 on the monthly time frame.


Tuesday, April 19, 2016

Learn from the Pro: How to trade Inside Bars


Most traders know how important it is to be able to identify and analyse different candlestick patterns.

The inside bar candlestick pattern can be seen quite often and it is an important source of information that can help us make our trading decisions. Even more importantly, the inside bar candlestick pattern provides some of the most reliable signals in this type of analysis and many traders use strategies that are based on such signals.


The online broker ActivTrades is organizing a webinar on the 21st April when the professional trader Paul Wallace will teach you how he identifies and trades these candlestick patterns.

The webinar is completely free for everyone and you can register for it by following this link>>> .


Monday, April 18, 2016

CAD/JPY Is Still Trying to Break Above the Resistance


Since the pair could not break above the resistance at 85.30 – 85.50 several days ago and opened with a bearish gap when the market opened this week, today CAD/JPY started testing the resistance level again.

The pair recovered the gap and continued climbing, reaching the same level it visited four days ago, at the resistance at 85.00, visualized by the blue line of the Bollinger Bands middle band on the daily time frame. A little above that level (85.30 – 85.60) is the other resistance level visualized by the green line of (EMA)89 on the same time frame.  It is obvious this is a very strong zone of resistance, but it is also very telling that the pair returned to that level so decisively which is an indication that CAD/JPY is still trying to break above it.


Another signal that supports this idea is the doji candlestick that formed on the weekly time frame, which suggests that the move to the downside might be over for now.

In case the pair does break above the resistance the next target is around 87.00.


Friday, April 15, 2016

USD/CAD Began Consolidating before the Final Drop towards 1.2650


I am examining the monthly USD/CAD chart, which clearly shows that the pair will have to fall another 150 – 200 pips to the support at 1.2650, visualized by the blue line of the Bollinger Bands middle band on the same time frame.


If you look at the weekly time frame, you can clearly see that the pair has also reached the lower band of the same indicator and has begun a sideways consolidation.


The consolidation appears even more obvious on the 4-hour time frame.


In my opinion, we can expect a more long-term consolidation until the pair reaches the trendline (the red line) on the daily time frame and once it does that we will see it drop towards 1.2650 – 1.2500.


Thursday, April 14, 2016

A Good Entry for Short-term Long EUR/USD Positions


There is a very good signal on the one-hour EUR/USD time frame for an entry for possible short-term long positions. The signal in question is several candlesticks formed in the one-hour time frame right above the support level at 1.1250 visualized by the lower band of the Bollinger Bands indicator.

That said, I think that it is unlikely for the pair to start climbing before the news coming from the USA later today.

If the pair does begin climbing, its first target would be around 1.1287 – 1.1290. We should also keep in mind that the news could turn out to be good for the American economy, which would push the pair down.

Wednesday, April 13, 2016

It Looks Like CAD/JPY Will Continue Rising


After the false break below the trend line on the weekly time frame the pair fell with almost 200 pips, but it appears that was the end of the move to the downside, since CAD/JPY is once again climbing and is currently testing the resistance level at 85.30 – 85.50, visualized by the middle line of the Bollinger Bands indicator on the weekly time frame. On the daily time frame the same resistance level is visualized by (EMA)89.


It seems, however, that this time the pair will succeed in breaking above that level, so it can continue rising towards the next resistance level at 87.00 – 87.50. That is a quite strong resistance, since the pair has attempted to break above it twice and it has bounced off of it twice for the past two months (that is the red horizontal line on the weekly and daily time frames).

If the pair does succeed in breaking above that level the next serious resistance level is at 89.00 – 90.00.


Tuesday, April 12, 2016

USD/CAD Completely Fulfilled My Expectations and Fell Towards 1.2650


There are about 150 pips left until the pair reaches that level, which, if you look at the weekly time frame, is very little.

Since the downwards trend has been pretty strong so far, I doubt the pair will stop falling once it does reach that support ( (EMA) 89 on the weekly time frame, visualized with a green line) as well as the middle line of Bollinger Bands on the monthly time frame  (the blue line).


It is far more probable that it will continue falling for another 50 pips below the support and it will stop around 1.26 or even below that level. That, however, would be an excellent opportunity to trade the retracement, since I do not doubt that the pair would climb back to test the support it broke (1.2650) which would become a level of resistance instead.

Monday, April 11, 2016

GBP/JPY Might Be Beginning a Correction


The pair has been falling and falling hard for the past nine months.

Despite this you can see a signal on the daily time frame that a correction is about to begin.
 
Since the pair couldn’t stay below the support at 152.00 and despite the fact that it fell to 151.639, in the past two days the GBP/JPY formed an inverted hammer candlestick and a marubozu candlestick on the daily time frame, which are very telling signals that a correction might begin.


 After those two candlesticks there was another attempt to test the support at 152.00, which is also something that happens often at the beginning of a correction. If the pair does start rising the first level of resistance is, in my opinion, around 155.00 – 155.20, which is the upper band of the Bollinger Bands indicator that can be viewed on the 4-hour time frame.

In conclusion I would say that we should follow very closely how the pair behaves at that level.


Saturday, April 09, 2016

USD/CAD Has Been Falling Without a Correction for 12 Weeks Now


Although the pair fell with 1200 pips for that time period it seems that the move to the downside will continue.

There was a moment when it seemed that the pair would bounce off the weekly support at 1.2922 (on 18th March) and many traders I communicate with believed that would be the beginning of the expected correction.

The pair continues proving those expectations wrong for four weeks now.


Despite the small moves to the upside USD/CAD keeps returning to the support coinciding with the lower band of Bollinger Bands indicator on the weekly time frame and testing that level again and again. The line, meanwhile, is moving further and further down and the pair will most likely break below it sooner or later. Not to mention that meanwhile it formed a new low. I have little doubt that it will succeed in doing so and after that it will drop towards the support 1.2660 – 1.2650, visualized by (EMA)89 on the weekly time frame (the green line), as well as the middle line of Bollinger Bands on the monthly time frame.

That level of support is incredibly strong and I think the pair will bounce off of it and correction will really begin.


Thursday, April 07, 2016

EUR/GBP Is Close to a Reversal


After five months of a powerful upwards trend the pair finally reached the resistance level at 0.8100, visualized on the screenshot with the upper band of the Bollinger Bands indicator on the monthly time frame. That band is usually a very strong resistance level, which makes me think that the pair is close to a reversal and beginning a correction to the downside.

That said, I do expected the upward move to continue for another 100 pips or so – which is what is left to the trend line on the monthly time frame (the red line).

In conclusion, I think that EUR/GBP reaching 0.8180 will be turning point after which we will see the pair start moving to the downside.


Wednesday, April 06, 2016

GBP/USD Continues Falling while Waiting for the FOMC Meeting Minutes Announcement


The minutes of the FOMC meeting should be announced later today. Usually that announcement is a high impact event and it has a pretty strong influence on the market. Despite that expectation, the market did not wait for it while consolidating, which is what tends to happen before such events. Instead many pairs continued moving as usual.


GBP/USD broke below the trend line (the red line) and started moving to the downside towards 1.40.

It is quite possible that the pair will stop at that level while waiting for the news to come out. However, I think that it’s becoming more and more probable for the pair to continue falling and we could see it reach 1.38 or even lower than that.

Tuesday, April 05, 2016

ActivTrades Webinars: Trading and a Day Job


Do you have a problem combining your work responsibilities with your need and desire for successful Forex trading? Do you struggle to find proper balance between them?
If you do, don’t hesitate to register for the new webinar organized by the online broker ActivTrades.

Malte Kaub, the managing director at Traders’ Leadership Council in Londol will help take a completely different look at the true challenges behind combining your work and your trading, so that you can make simple but effective changes to your trading in order to get the balance right between them.

You can register for this incredibly helpful webinar by clicking here>>>.

All ActivTrades Webinars are available to the public, regardless of whether you’re a client of the company or not.

Monday, April 04, 2016

Downwards USD/JPY Trend Continues


The pair couldn’t climb higher than 113.80 and started falling again.

Under these circumstances it has become obvious that the pair is trying for another breakout below 111.00 – 110.70. In case it does manage to break below that zone, it will continue, I think, towards the next level of support around 109.00 – 108.70.

It is possible that the pair will continue falling below those levels, but that said, I also think that it is approaching a level when the move to the downside will end it will start climbing again. This move to the upside could begin around 108.50, 107.50 or even 104.50 (which coincides with (EMA)89 on the monthly time frame). At this point it is difficult to tell where the pair will start rising, but I am convinced that it will.


Friday, April 01, 2016

GBP/USD Started Falling Again


During the past few weeks GBP/USD has been moving in a way that has been quite beneficial for anyone interested in trading in it, since it has been so predictable.

All one had to do was to follow the signals appearing on the daily time frame and the movements to obvious levels of support and resistance up until the next signal that appeared on the daily time frame. I wish it is always this way, but unfortunately it’s not.


After the last two doji candlesticks formed under the resistance coinciding with the upper band of Bollinger bands (the blue line) and (EMA)89 (the green line) the pair started falling again. Its target is most likely 1.4060.

If it can break below that support then the next level of support is at 1.3850.

I think that if that a breakout below the support at 1.3850 occurs then then bearish trend will continue. For the moment it’s too early to tell and we will have to wait and see what candlesticks will form in the following days.