Saturday, June 30, 2018

I Expect The Downward GBP/JPY Trend To Continue


The pair formed a trend channel that lasted for almost 18 months (starting from 15th December 2016 to the breakout to the downside on 23rd May 2018).

Although the pair has tested the trend line it broke out below it could test the same trend line again and the resistance zone from which we can expect a renewal of the depreciation is at 148.50 – 149.20.
From that zone we could expect a renewal of the bearish trend to the next strong support zone around 136.50 -  135.50.

Below that are the supports at 129.00 – 128.50 and the local low at 128.37, but that is a long term scenario. 

The alternative scenario is for a renewal of the rally from 135.50 – 136.50.


Friday, June 29, 2018

USD/CAD Finally Began The Expected Depreciation

The pair has reached the first target to the downside at 1.3150, but in my opinion the depreciation is not over.

In case the pair breaks out below the support I think it will head for the next support level which is the diagonal trend line marked with a thin red line (that is the 1.2980 – 1.2950 zone).


On the D1 time frame one can also notice a Gartley butterfly pattern, the limit of which is point A. With the caveat that not nearly all limits of Gartley butterfly patterns are reachable, it would be interesting to see whether the pair will reach this one. If that happens we should expect a depreciation to 1.25621.

In the alternative scenario after a drop to 1.2850 the pair would renew the move north.


Wednesday, June 27, 2018

Are We Observing A Test Of The Support Or Is AUD/USD Renewing Its Downward Trend?


After a move north AUD/USD returned to test the support at 0.7340 – 0.7300 (the golden line) which is natural for pairs that are in a strong support or resistance zone.


If we examine the smaller time frame, however, for example the M30 one, we would notice how range-bound the pair is, which is an expression of the struggle between of the bulls and the bears on the market.

In such situations the best thing one can do is wait. If there’s a breakout and the price remains below the local low at 1.72453 that would mean that the pair will head for the next support at 0.7170 – 0.7110 (in blue) without further correction, so that move can be traded.

The alternative scenario is for a deeper correction to 0.7470 – 0.7480.


Tuesday, June 26, 2018

Trade Shares With ActivTrades


Through trading with the competitive online broker ActivTrades you will have access to the enormous global market. Trade shares through this broker and you will enjoy the following excellent benefits:

-You will have access to trading over 450 company shares without any stamp duty, custody or account management fees.
-You can trade them on a mobile device.
-The leverage is up to 1:20.
-There are no mark ups and no hidden fees!

You can invest in bullish and bearish markets with ease and with minimum cost. Trade on the global stock exchanges like New York, London, Frankfurt, Milan, Paris and so many more!

You can learn more about trading shares with ActivTrades here.>>>


Monday, June 25, 2018

The Forex Calendar For This Week


This week there are several important events traders should look out for because they may have a major influence on the way the market develops:

Monday is free of any events.

On Tuesday, however, we can expect the US CB Consumer Confidence data and the ANZ Business Confidence data.

On Wednesday there will be a speech by the Bank of England Governor Carney, and we can expect the US Core Durable Goods Orders and Crude Oil inventories. There will also be a speech by the Bank of Canada Governor Poloz and the Reserve Bank of New Zealand will announce its Official Cash Rate.

On Thursday the US will announce the Final GDP data.

And finally, on Friday, we can expect British Current Account data and the Canadian GDP data, as well as a Bank of Canada Business Outlook Survey.

Saturday, June 23, 2018

The Expected USD/CAD Correction Began, The Target Is At 1.30

After one last rally USD/CAD finally began the long-awaited correction.

There is little left until it reaches its first target to the downside (the pale blue line of the breakout of the trend channel), and I think the pair will reach it on Monday night (GMT) once the new trading week begins.

The next targets to the downside, in my opinion, are 1.3060 and1.2970 – 1.2950 so that it would test the breakout of the red trend line.


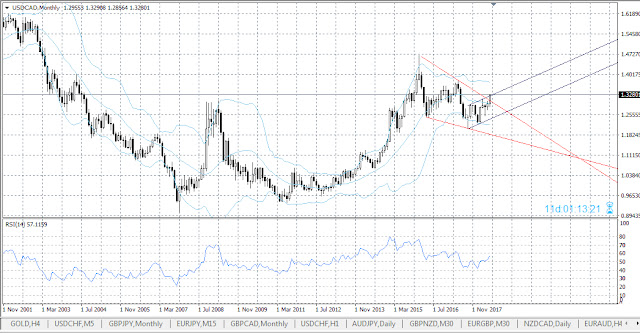
Also, if we examine the monthly time frame, 1.2970 is a strong support level. We should be very careful around that zone, because we could expect a renewal of the upward movement to 1.3650 – 1.3680.

The alternative scenario is for the depreciation to last to 1.2280 – 1.2250.


Friday, June 22, 2018

The Most Probable USD/JPY Scenario Is A Depreciation


USD/JPY continues developing within a relatively wide range for a fourth day now, locked between 109.50 and 110.70 and neither can it break out below the support in the zone around 109.50 and 109.80 nor can it rally and reach its target at the resistance trend line (in red) of the channel.

On the H4 time frame there is a Gartley Butterfly pattern (in red) as well as a pennant (in blue) and the pair has broken out below it.


The closest target to the downside is at 133.40 and if the pair reaches the limit of the Butterfly then the depreciation should last to 108.10 – 108.00. That is a strong support zone on the W1 time frame, so how it will develop further depends on the way the pair behaves when it reaches it.

The alternate scenario is for a direct rally to 111.50 – 111.60 (on the W1 time frame), but that scenario appears less probable for the moment.

Thursday, June 21, 2018

The Closest Target Of The Depreciation Of AUD/USD Is The Zone 0.7170 – 7110


After the pair tested the support trend line it broke out below (in red) and could not breakout above it, which turned the trend line into a resistance one, the AUD/USD pair started dropping sharply, depreciating with about 340 pips for three weeks.


For the moment the pair looks like it will find support in the zone 0.7340 – 0.7300 (the golden line). It is possible to really begin forming a correction to 0.7450- 0.7480 within that zone, which will give the pair the opportunity to gather liquidity to test the next strong support at 0.7170 – 0.7110 (in blue).

There we can expect a strong and long term correction to the upside, but it is too early to make a prognosis how far it could reach.


Tuesday, June 19, 2018

The Powerful USD/CAD Rally Continues


 Contrary to my expectations for a depreciation, after the breakout above the resistance around 1.2990 – 1.30 the USD/CAD pair continued rallying and is now at 1.3280.


The noticeable thing is that despite the large rally the trend does not show any signs of exhaustion. In my opinion, there are no trustworthy signals even for an impending corrective depreciation – neither the bars hint at that, nor does the RSI indicator. The RSI divergence is only on the H1 time frame, but in my opinion it has not been confirmed for the moment and it is not particularly trustworthy, so it is not very likely to come to fruition.

Under these circumstances it’s prudent to keep long positions with the appropriate Stop Loss that protects one’s profits and account.

I think that even if there is a correction in the future it won’t be very deep and the visible target of the rally is around 1.3690 – 1.3700.

Monday, June 18, 2018

Will EUR/USD Really Form A Double Bottom?


Last week was rich in important financial news coming from both the USA and the EU and the pair managed to form a pattern that for the moment hints at the presence of a double bottom.

It has reached 1.15097 on 29th May 2018 and 1.15429 on the 15th June 2018.

I have already mentioned that I expect the beginning of the second wave of the correction after the impulse rally from 1.03400 (3rd January 2017) to 1.25556 (16th February 2018). For the moment the pair has reached a zone where it could find support and the bars on the H1 and D1 time frames are hinting that said zone could really be a strong support and the double bottom will become a reality. If that is a correct scenario then we could expect a corrective long term move north to form said second wave.


In the alternate scenario there could be a corrective move north from the current level to 1.1680 – 1.1800 and then a new depreciation to 50% and 61.8% Fibo of the impulse and only then there could be a major corrective rally.

In the third scenario the pair will continue depreciating to 50% and 61.8% Fibo of the impulse, then it would begin the correction.