Friday, September 30, 2016

Trading with Trendlines: Will GBP/USD Continue Dropping ?


No matter how perfect the trendline or the price channel there is always a breakout. And this is what we are waiting for – a breakout that we can use to trade.

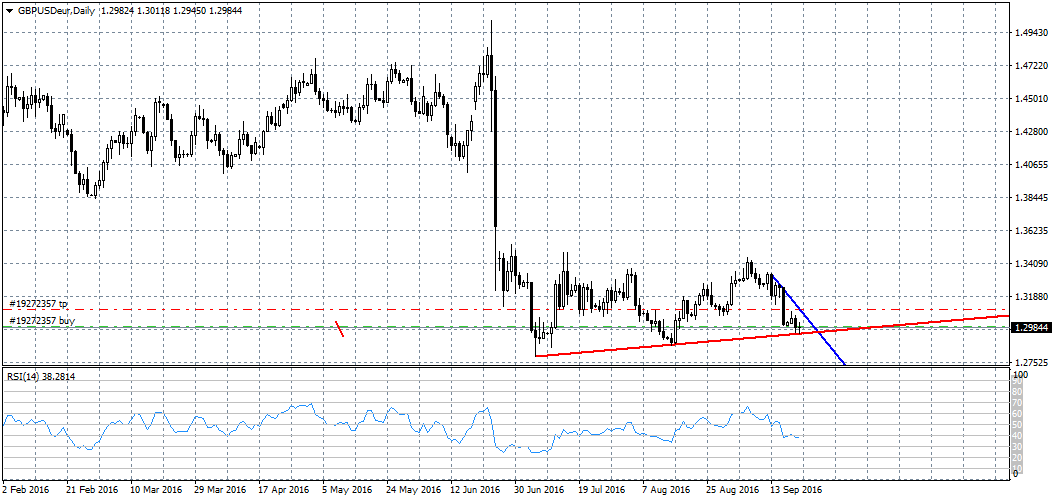
This is what happened with GBP/USD, which broke below the support trendline of the price channel from 1.29258 to 1.30214 and reached its limit of 67 pips, i.e. the exact height of the channel at its base that was projected to the downside from the breakout level.

This is where we should start looking for an opportunity to draw new trendlines.

Above all else I want to point out that the 1.29500 – 1.29300 zone is a strong support zone and on the chart we can see that the pair has reached it and rebounded from it from it many times, including in the past few days.

In case there is a breakout, the support trendline of the move to the downside (the red line) will offer the next level of support, which is the zone around 1.28900 - 1.28700.

In the alternate scenario there will be a move to the upside towards the support trendline that the pair broke below, or even towards the resistance trendline (the green lines) of the trend channel.

Thursday, September 29, 2016

WTI Will Rise in the Following Month


The focus of today’s analysis is the American light crude oil or WTI.

After the drastic drop from 1st June 2014, when the WTI was priced at $107.640 per barrel to 1st February 2016, when it was $26.035 per barrel, its price finally started to slowly recover.

If we look at the monthly time frame we will see that the move to the upside began in a typical way – with a pin bar and with a correction that lasted almost five months until it reached around $45 per barrel.

It all makes it seem that it will continue rising and I think it will likely reach $65 - $68 per barrel over the next few months. The reason for that expectation is my technical analysis, which is based on a simple but effective rule: in technical analysis the corrective waves usually form in threes, with the first and the third wave usually being with the same height. That is exactly what we can see on the chart – the beginning of a third corrective wave to the upside.

Of course, oil is a strategic resource and its extraction and sale depend on powerful economic interests, so not everything depends on technical analysis. Keeping in mind the OPEC members’ decision from yesterday to curb oil output, I think that my expectation based on technical analysis about the oil price will come very close to reality.


Wednesday, September 28, 2016

Trading with Trendlines: GBP/USD Today


After the impressive bullish bar on the 4-hour time frame the GBP/USD pair formed a double bottom with the second low being only 0.9 pips higher than the first, as well as a doji bar on the same time frame, after which it started moving up again.

At the moment the pair is caught between two trendlines – the blue one of the bearish trend that began on 6th September 2016 and the red one of the move on the upside that began on 26th September 2016.
The impressive doji bar on the four-hour time frame has closed right on the resistance trendline.

Now we need to be careful and to watch the pair closely to see whether it will succeed in remaining above the resistance it broke above or will it retrace back below that level.

In case the pair does succeed in rebounding from the trendline it broke above, which in this case will have turned into a support, we will see another move to the upside towards 1.3050 - 1.3080.

In the alternate scenario, in my opinion, there will be a drop towards 1.2870 – 1.2850.

Monday, September 26, 2016

Trading with Trendlines: EUR/USD Today


After EUR/USD began rising from the support at 1.11227 when FED announced the interest rate last Wednesday this move to the upside continued in the following days and continues today.

The trendlines that  I drew>>>  before the news came out and before the Janet Yellen press-conference, especially the resistance trendline, still appear valid. What is more, the pair is close to reaching its target – the resistance around 1.12850 - 1.13000 and I have little doubt it will reach that level.

In my opinion, it is still too early to make a proper prognosis what will happen once the pair reaches this target, but the way it develops at that level will add some clarity to the issue and any trading decisions that follow will depend on said developments.


Saturday, September 24, 2016

Trading with Trendlines: GBP/USD in the Beginning of Next Week


My analysis about GBP/USD from 21st 09 2016>>>  was correct and all that I expected happened.

The pair reached the resistance trendline at 1.31000 and rebounded to the downside, towards the support at 1.29450. It even succeeded in breaking below that level and reaching 1.29147, but it could not remain below that level for long, and climbed back up towards the breakout at the trendline, closing as a pinbar at 1.29577 on the four-hour time frame.

The pair retracing and forming that pinbar above the breakout, as well as the increasing divergence on the four-hour time frame between the chart and the RSI indicator (I am referring to the last four lows), convince me even more that in the beginning of the next week we will see a renewal of the move to the upside and we will also likely see a new test of the resistance trendline around 1.30200 – 1.30250, after which I think there will be a new drop to test the support at 1.28400.


In the alternate scenario there will be a move to the upside towards 1.32000 and higher, but at this stage this seems less likely, considering the bars on the weekly time frame, which are clear signals for a move to the downside.


Friday, September 23, 2016

Trading with Trendlines : USD/JPY Today


Today I am following the USD/JPY pair.

On the thirty-minute time frame we can see that the pair is forming a flag.

To reiterate what the flag characteristics are:

-There is a strong resistance or support that is causing the consolidation.
-The figure is corrective, forming in a direction opposite of the main trend.
-After there is a breakout the trend continues, and so this is considered a trend-continuation figure.
-You need four points to draw it.
-The support and resistance trendlines are parallel or slightly converging.
-The flag is relatively smaller than the trend it is correcting.
The limit of the flag is its height at its base, in this case between low 1 (in red) and high 1 (in blue) in pip value. We have to project that height from the breakout level in the same direction as the trend.

It is imperative, however, to wait for a breakout and common sense dictates to place pending orders a few pips below the breakout level.

In this case the possible limit is 67 pips.


Wednesday, September 21, 2016

About Trendlines and Their Importance in Technical Analysis (Part 3)


Later today we can expect the announcement of the FED interest rate, as well as a speech from FED Chair Janet Yellen.

Although such news usually cause tension and the market volatility drops until it comes out, I want to share what I expect and what my positions are beforehand. I made my decisions based on important trendlines and the pin bars that formed on the four-hour time frames.

EUR/USD: I expect that the most traded currency pair will move in favour of the EUR. The pair is at a support level at 1.1123 and on the four-hour time frame there is a bullish pin bar. I expect a move to the upside, towards the resistance trendline that has been framing the figure that the pair has been forming since 8th August this year.


GBP/USD is also at an important support level (the red line). What is more, in the past 24 hours the pair formed a double bottom on the four-hour time frame, not to mention that the two bars there are bullish pin bars. I expect a move to the upside towards the resistance trendline (the blue line) around 1.2090 – 1.3100. Once the pair reaches that level I think there will be a renewal of the move to the downside.


Tuesday, September 20, 2016

Live Trading Analysis - FX, Commodities & Indices


No lesson is more helpful than the practical one.

On the 22nd September you will have the wonderful opportunity to observe the professional trader Malte Kaub, who is Managing Director at the Traders' Leadership Council in London, reviewing live price market action during a webinar organized by leading broker ActivTrades. Mr. Kaub will help you learn to read the “story” from the chart and will give you practical insight into the application of proven technical analysis strategies for Forex, commodities and indices.


For more details and to register for this webinar please follow this link.>>>

Like all ActivTrades webinars, this one is open and free to the public as well.


Monday, September 19, 2016

About Trendlines and Their Importance in Technical Analysis (Part 2)


Today the GBP/USD pair was retracing after the 250 pips drop last Friday, but despite that there was an opportunity to profit. One look at the charts was enough to notice the price channel in which the pair had been moving since the market opened during the night. The pair rose with 95 pips between the parallel lines of the price channel.

Since I know that after such a 250 pips drop a correction is all but mandatory, I used the smallest possible time frame (in this case the fifteen-minute one) and I opened a long position after noticing a divergence between the chart and the RSI indicator, placing a stop loss a few pips below the support at 1.2996.

After GBP/USD formed a pair of higher lows (the red 1 and 2) I drew the first trendline (the darker blue one). After that I drew the parallel trendline through the first high (the lighter blue line). That way the price channel was visible and I could trade from a high to another high, watching the price closely and closing my position – and profiting – every time the pair reached the resistance trendline.


The Bollinger Bands indicator also helped when the pair reached high 5 (in blue) at the upper band of the indicator on the one-hour time frame, which was a signal that the move to the upside had most likely ended for the moment. I was right about that and the pair started dropping, which gave me an opportunity to open a profitable short position. Meanwhile the pair not only reached the support trendline (the dark blue one) but it also broke below it.

This correction probably isn’t over, but I have closed my position and I am waiting for further development before I make any new decisions.

Saturday, September 17, 2016

About Trendlines and Their Importance in Technical Analysis


Many newbie traders and some more experienced ones don’t realize how important trendlines are in technical analysis and how one can use them to improve their trading skills.

I know from personal experience that the moment I learned to draw the correct trendlines the chart essentially started “talking” to me in a clear language.

Unfortunately, many technical analysts often somewhat ignore trendlines and count more on indicators, candlesticks, waves and other approaches that can complicate a trader’s understanding of the logic of the forex market.

In the next few posts I will try to show how trading can be made easier by knowing how to draw the correct trendlines on every given chart and how much can all traders learn from them regardless of their level of experience.


Friday, September 16, 2016

Gold Will Likely Rebound from 1307 - 1290


Gold has almost reached the resistance trendline of the possible pennant>>> and if my analysis that Gold really is forming a pennant is correct then soon there should be a move to the upside.

In such a scenario the movement between the trendlines should continue for another few weeks, after which there will be an impulse move to the upside towards the limit of the wedge (the green trendlines) which is at 1423.

In case Gold breaks out to the downside it’s possible to continue dropping towards 1200 or even below that level.

We don’t know which scenario the market will pick, which is why we should be very careful while Gold is in the zone around 1307 – 1290 and we should wait for further development before we open long positions.


Thursday, September 15, 2016

Despite the Poor US Data the GBP Is under Pressure


Despite the fact that the data about the unemployment claims in the US was only a little worse than the one last month the GBP came under pressure.

The GBP/USD pair attempted to continue moving south, although the attempt wasn’t very convincing. Today the GBP/USD pair dropped with 91 pips and at the moment it’s at 1.3195, 1.3175 – 1.3195 is a strong support zone.

If the GBP succeeds in breaking below the support we will probably witness a new drop towards 1.3100 and after that another one towards 1.3050.

In the alternate scenario the pair will rise towards 1.3270 and then towards 1.3350.

Whichever of the scenarios the market ends up favouring the higher levels will give us a good opportunity to open short positions, in my opinion.


Tuesday, September 13, 2016

At This Stage Gold Is Forming a Figure Resembling a Pennant


If we draw the trendlines on the daily time frame at this stage we can observe the formation of a pattern that strongly resembles a pennant. Let’s consider a pennant’s characteristics:

-It’s a corrective figure that is forming a direction opposite of that of the overall trend.
-It has converging trendlines.
-There is a support or resistance level that causes said correction.
-The figure appears smaller (at this stage) than the overall trend.
If this really is a pennant we need to keep in mind that this is a trend-continuation figure and we can expect a breakout to the upside.

That said, the figure hasn’t finished forming and all we can do for the moment is to follow its development, waiting for the breakout that will make it clear whether this is a valid scenario or not.


Monday, September 12, 2016

GBP/USD Broke Above the Flag Trendline and Began Rising as Expected


The pair broke above the trendline at the 1.33286 level, but before that unsurprisingly it dropped only to form a double bottom at the support at 1.32400. Considering that double bottom it was also unsurprising that it continued moving to the upside.

The limit of the flag is at the 1.34080 level, which is a strong resistance, but if GBP/USD succeeds in reaching that limit and breaks above the resistance then I think that the move to the upside will continue all the way to the resistance trendline of the bullish channel that has been forming since 15th August this year. Of course, such a development will last for quite a while and it is possible for our expectations to change according to the new patterns we see the pair form.


Saturday, September 10, 2016

EUR/NZD Closed the Week with a Pin Bar and a Bullish Divergence


The pin bar and the divergence on the RSI indicator are very obvious on the weekly time frame. That means that next week we can expect a move to the upside.

Since the figure we can see on the screenshot is a flag with four clear points we can use to draw it (which is a necessary and acceptable condition to define this pattern) we could conclude that the move to the upside will continue to the resistance trendline towards the 1.6140 level.

From that point there are two scenarios:

In the first scenario the pair will break above the trendline and it will reach the limit of that flag which is 180 pips from the breakout level to the upside.

In the second scenario the pair will drop and only then start rising again and break above the trendline.


Considering that before it started forming the flag the pair rose with 450 pips, I think that the second wave to the upside on the monthly time frame could rise with another 450 pips after the breakout.


Friday, September 09, 2016

AUD/USD Tested the Pennant Trendline It Broke Below and Continued Falling


AUD/USD tested the support trendline of the pennant that formed between 26th May to 26th August 2016 after it broke below it and today the pair continued falling.

The limit of the figure you can see on the chart is, as we know, the height of the pennant at its base, projected from the breakout level to the downside.

That means that AUD/USD will drop at least 380 – 390 pips from the breakout level at 0.7607, in other words, it should reach at least 0.7230.


Since such a drop would mean that the pair would break below the support trendline of the correction that began at the beginning of January 2016 (the dark-blue line), that could signal a renewal of the bearish trend.

Thursday, September 08, 2016

Will USD/CAD Succeed in Breaking above the Trendline?


After the Bank of Canada rate announcement yesterday USD/CAD sharply moved up with a little over than 90 pips and today it continued climbing while at the same time it headed towards the resistance trendline of the overall move to the downside that began from 1.31474 (since 1st September 2016), which it hadn’t tested up until now.

Unsurprisingly, the pair reached the trendline at 1.29349, after which it retraced all the way to 1.28625, which was practically below 61.8% Fibo of the entire move to the upside today.


At the moment the pair is being traded around its highest levels for the day, but since this is a correction and on one side the American session is about to end, on the other  - there is a doji bar at 1.29193 on the 30-minute time frame - I think that during the Asian session we’ll see another corrective drop. It’s difficult to make a proper prognosis about how the pair will move tomorrow, because on the 1-hour time frame there is an impressive hammer bar which generally is a signal for a move to the upside.

If this scenario is valid, then the pair should break above the trendline and continue climbing.

In the alternate scenario we can expect a drop towards the support at 1.28800 and then towards 1.28200.


Tuesday, September 06, 2016

ActivTrades Webinar: Trading the US Indices


Many people are afraid or unwilling to trade the US indices like NASDAQ, Dow Jones and others because they think they are complicated and difficult to trade, not to mention very dependent on the fundamentals.

Now, however, the leading online broker ActivTrades has organized a webinar, which will be taught by professional trader Paul Wallace, who will provide an intro into trading the traders' champions’ league - US indices markets.


 This webinar will be held on 8th September, from 7pm to 8pm and like all ActivTrades webinars it will be open and free to the public.

To learn more about this webinar and to register for it click on this link.>>>

Monday, September 05, 2016

After Forming a Pennant for Three Months USD/CAD Broke Below It and Continued Dropping


The USD/CAD pair has been consolidating for three months now, forming a trend-continuation pennant figure.

Let’s list the main characteristics of a pennant:
1. It forms in a direction opposite of the main trend or it’s flat.
2. It forms faster compared to the main trend.
3. You need four points to draw a pennant.
4. The pattern has converging trendlines.
5. The breakout usually occurs between 2/3rds and 3/4ths of the length of the pennant.
6. After a breakout there is usually a retracement to test the level of the breakout.
7. The pennant is a trend-continuation pattern.

We can observe a pennant on the USD/CAD daily time frame that fits all these conditions. Logically, the pair continued moving in the same direction of the main trend.

The limit of this figure is its height projected from the breakout level and considering that its height is around 550 pips and the breakout level is at 1.3040, then I expect the move to the downside to eventually reach 1.2480.

Saturday, September 03, 2016

USD/JPY after the NFP


Another pair that surprised traders after the poor NFP data yesterday was the USD/JPY.

It was logical for the USD to drop, but no such thing happened.

The pair moved inexorably to the upside and did exactly what I expected it would do and wrote about in my last post>>>  – it broke above the resistance trendline, retraced and on its second attempt decisively broke above the trendline, with the daily candlestick closing above it.


I think such a breakout, in combination with the double bottom that we can observe on the daily and weekly time frames, as well as the strong divergence of the RSI indicator on the daily time frame, can be considered the first signal for a trend reversal.

In my opinion, after yesterday’s move to the upside that lasted around 160 pips, next week the pair will likely test this breakout level and then continue moving to the upside towards 105.00.


Friday, September 02, 2016

The NFP Were Worse than Expected


Since the US Non-farm Payrolls are usually announced on the first Friday of every month, it is also usual for the market to suffer from low volatility while traders and investors are anxiously waiting for the news, and as a results those of us who still trade have to trade most pairs in consolidation.

This Friday was no different. The data released was worse than what was expected and as a result it provoked strong movements in a set direction. There were no big spikes for the most part, which is something that also happens often during and right after the announcement of the NFP. Of course, most USD-related currency pairs moved against the USD.

I think that the biggest surprise for the traders, however, came from the EUR/USD pair, because after the EUR soared in a powerful rally following the news it then crashed in favour of the USD.

Such surprises, unfortunately, happen occasionally and they are a good reason why we should always be very careful when we trade the news, if we choose to trade the news.