Wednesday, February 28, 2018

USD/CAD Is Developing A Pennant

USD/CAD is heading for the resistance trend line (in red) around 1.3050 – 1.3100.

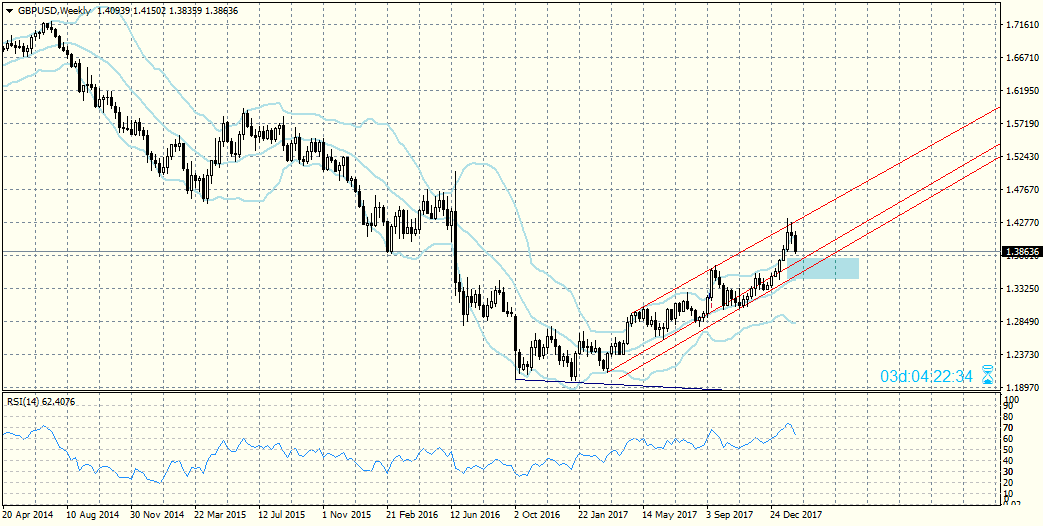
The figure that has formed strongly resembles a pennant with its flagpole and four points at which the pair has reached the trend lines, two at the resistance and two at the support. The pennant is a trend continuation figure, which means that there should be a breakout above the resistance trend line and in that case its limit should be over 2200 pips.

In my opinion, however, the figure will continue developing and once the pair reaches the resistance it should reverse and renew its depreciation to the support trend line.

For how, I think, the target is clear – there will be another rally for 150 – 180 pips after which we should watch closely how the pair will behave once it reaches the resistance trend line.


Tuesday, February 27, 2018

The EUR/USD Correction Continues Developing

As I thought, the EUR/USD correction is not over yet. The pair resumed its depreciation and I think it is headed for 1.2180 – 1.2140. That is a strong support zone and I think it will probably stop the depreciation.

1.2140 is at 50% Fibo of the supposed third out of fifth wave, and a fall to that level would mean the development of a rather deep fourth wave. According to the Elliott Wave Theory when there is an impulse the fourth waves usually reach 38.2 % Fibo although sometimes there are more shallow (23.6 % Fibo) and deeper (50 % Fibo) waves. If the supposed fourth wave is deeper than 50 % we should re-examine the way we count the waves.

For now, however, my expectation is for a deeper fourth wave, after which the pair should renew its rally for a fifth out of fifth wave as it is marked on the screenshot, a count which is still valid, in my opinion.

Monday, February 26, 2018

There May Be A Bullish USD/JPY Correction

The USD/JPY pair broke out below the support zone around 108.00 – 107.50 but it stopped at the next support at 105.54 (in dark green).

That is logical, considering that the pair has reached that support twice in the past few years – once in October 2014 and then back in May 2016. That said, that support is not particularly strong in my opinion, and there is little doubt that the pair will break out below it, but before that it seems we’ll see a corrective move to the upside.

 The last closed bar on the W1 time frame is also a signal for that, as well as the D1 pin bar from 16th February, both of which are hinting at a bullish tendency with a possible rally to 109.50 – 110.
That is just a correction however, and once it’s done I think the pair will head for its next target to the downside, which is the support in the zone around 100.50 – 99.50.

Friday, February 16, 2018

The EUR/USD RSI Divergence Is Deepening

Yesterday the EUR/USD pair continued moving north throughout the day and it even reached a new local high at 1.25556 which is two pips less than the local high from 5th January 2018 (at 1.25375).

Regardless, the RSI on the D1 time frame is signaling for a possible depreciation. If the pair reaches the limit of the divergence it could fall to 1.2100 – 1.2090.

There are mere hours left until the end of the trading week and the way the D1 bar closes could give us another confirmation for the possible depreciation.

The expected movement is corrective and it should be part of the fourth wave >>>  before the pair renews its rally for the final fifth wave.

This scenario will be invalidated in case RSI breaks out above the red line connecting the highs of the divergence.


Thursday, February 15, 2018

An Upward USD/JPY Correction Is To Be Expected

The pair maintained its downward trend throughout the week and today it approached the support around 116.00 – 105.90.

I think that around that support there are several probable scenarios:

The first scenario is that it is possible for the pair to test the support and to begin a correction to the upside.

The second scenario is that the correction has already begun while the expected critical target for the move to the upside is around 107.90.

In case the pair breaks out above that level and it manages to remain above that level we could consider a renewal of the upward trend.

The alternative is that we could witness the formation of a new local low around 105.20 – 105.00.


Wednesday, February 14, 2018

The EUR/USD Fourth Wave Correction May Not Be Over Yet


EUR/USD may be forming a fourth (light blue) wave of the fifth subwave of the third main wave of the impulse. That wave counting is probably most clear to those who have some idea of the Elliott Wave Theory but in this case, considering the impulse to the upside and the impulse formations in general it is not hard to recognize it.

If that supposition is correct then the pair may depreciate once again, to 1.2200 but it should not drop below 1.19611, i.e. below the high of the potential first (light blue) wave.

After the end of the fourth wave we could expect another impulse to the upside which will form the final five waves and with that the entire main (red) third wave will end.

There is a possibility, I think, to see a shortened fifth (light blue) wave, in which case the high of the last fifth (light blue) wave won’t reach the high of the third (light blue) wave, but that usually happens during a lot more powerful movements and such a movement seems to be lacking in this impulse.


Tuesday, February 13, 2018

The Predictions Regarding Bitcoin Development Vary Widely


Despite its rather impressive drop from almost 20,000 dollars per Bitcoin the most popular cryptocurrency on the market is once again moving north, albeit not at such an accelerated pace as it used to before its depreciation.

The predictions concerning its future development vary wildly from analyst to analyst. According to some assessments, Bitcoin will rally up to $30,000 - $35,000 until the end of the year and up to $100,000 over the course of the next few years. According to other very generous assessments, we may see a rally of up to $1,000,000 
eventually. Whether that is an exaggeration or not will become clear over time.

Of course, there are some very skeptical analysists as well, predicting another depreciation to $5000 per Bitcoin.

Monday, February 12, 2018

USD/JPY Is Still Testing The Support Zone


USD/JPY continues making attempts to break out below the first support zone>>>  at 108.00  - 107.50. For the moment the pair has reached 108.04 and I think it is possible it will continue testing that zone. In my opinion, if it breaks out below it and remains below it we could expect a continuation of the depreciation toward the next support at 50% Fibo (at 100.50 – 99.50) of the impulse that began in October 2011 (at 75.564) and ended in June 2015 (at 125.854) on the monthly time frame.


The alternate scenario is for a new rally to 109.30 – 109.50 which could completely neutralize the attempt for a depreciation and return the pair in the consolidation that formed for the past two weeks.


Saturday, February 10, 2018

EUR/JPY In The Next Few Weeks


EUR/JPY reached the limit of the multi-day range between 131.40 and 134.40, as you can see on the screenshot of the D1 time frame, and right after that it began to depreciate.


On the W1 time frame we can see a RSI divergence and if the pair reaches its limit it should fall to 128.50 – 128.40. At that level there is a support zone marked by a light blue line on the monthly time frame.

 The next support is at 125.50 – 125.00 and it is marked with light green.


The alternative scenario is for a rally to the resistance in the zone around 139.00 – 139.50.
We should also watch the RSI divergence – in case there is a breakout above the divergence trend line we could expect a rally to the resistance zone.


Thursday, February 08, 2018

EUR/USD Is Developing A Fourth Wave Correction

When impulse is in development (according to the Elliott Wave Theory), the movement of any given pair is easily predictable, because the impulse waves develop according to very strict rules. In this case the EUR/USD rally makes no exception.


If we examine the W1 time frame we could suppose that at the moment is developing a fourth wave (in green) from the fifth blue wave, within the third red wave.

If that supposition is correct we can expect that the corrective depreciation that has reached 38.2% Fibo of the supposed third green wave either won’t end at that level or it could develop a little more and reach 1.2125 – 1.2100 which is 50% of the impulse rally of the same wave. After that, I think, we could expect the final rally of the fifth green wave (of the fifth blue) within third red wave.


Wednesday, February 07, 2018

GBP/USD Is Headed For The Support Trend Line OF The Channel

GBP/USD continued developing within a perfect trend channel reaching a local high at 1.43452 and, without managing to reach 1.4350, formed a doji bar on the W1 time frame and an Adam and Adam double top on the D1 time frame, signaling for its impending depreciation.

This week that depreciation has become a fact and I think that the pair is headed for the support trend line of the channel, its target being around 1.3670 – 1.3650. If it breaks out below this support it is possible for the depreciation to continue toward the strong support on the W1 time frame around 1.3550 – 1.3500, which is marked on the chart with a blue rectangle.

Should the pair break out below that support it could keep depreciating to 1.3000 – 1.2950.

The alternative scenario is for a rebound from the same support and a renewal of the rally within the trend channel.


Tuesday, February 06, 2018

An ActivTrades Seminar: An Introduction to Bitcoin and Cryptocurrencies


The popularity of cryptocurrencies has been growing since 2009 and lately it has done so exponentially, so now is the time to learn more about these instruments. You can do so by attending the seminar organized by the leading online broker ActivTrades in Dubai, titled “An Introduction to Bitcoin and Cryptocurrencies”.

There Dr. Saifedean Ammous, who is Professor of Economics at the Lebanese American University and member of the Center on Capitalism and Society at Columbia University, will answer many pertinent questions about Bitcoin and other cryptocurrencies.

The seminar programme will involve:
-An Introduction to Bitcoin and cryptocurrencies, answering questions about how Bitcoin works and whether it is secure.
-Supply and Demand dynamics
-Other cryptocurrencies such as Ethereum, Ripple, Litecoin and their supply, demand and use cases.

The “An Introduction to Bitcoin and Cryptocurrencies” seminar will be held on 12th February 2018 in the Dusit Thani Hotel, Dubai.

You can learn more about the seminar and register for it here.>>>

Monday, February 05, 2018

The Forex Calendar For This Week


This week there will be many events that will have a serious impact on market volatility, the main event being the Bank of England Official Bank Rate announcement on Thursday. Apart from that here are the other events we can expect:

On Monday are announced the British Services PMI, the US ISM Non-Manufacturing PMI, the Australian Retail Sales m/m, Trade Balance, a Reserve Bank of Australia Statement and there will also be a speech by the ECB president Mario Draghi.

On Tuesday we can expect the Canadian Trade Balance, the New Zealand Employment Change q/q and Unemployment Rate.

On Wednesday most events will be Reserve Bank of New Zealand-related: they will announce their Monetary Policy Statement, Rate Statement and the RBNZ Governor Carney will speak. Apart from that we can also expect the announcement of the US Crude Oil Inventories.

On Thursday there will be a speech by the Reserve Bank of of Australia’s Governor Philip Lowe, the Bank of England Inflation Report will be announced, together with the MPC Official Bank Rate Votes, Monetary Policy Summary and, as I mentioned, Official Bank Rate. The reserve Bank of Australia will also announce its Monetary Policy Statement.

On Friday will be announced the British Manufacturing Production m/m, the Canadian Employment Change and the Unemployment Rate.

Saturday, February 03, 2018

USD/CAD May Return Within The Consolidation

The rally I expected from USD/CAD finally became a reality, but that happened only after the NFP data was released yesterday.

Although I have drawn the trend lines of the downward movement and they look like the pair is forming a wedge the figure cannot be interpreted as such, because one of the most important features of such a figure is missing – reaching the trend lines at least four consecutive times. In this case that has happened just three times and then there was the breakout to the upside.

Meanwhile the pair deepened the RSI divergence with new lows of the price compared to the indicator and that required recalculating the possible limit of that divergence, which is at 1.2700 – 1.2710.

To the upside the first resistance is around 1.2580 – 1.2600, followed by 1.2700 – 1.2710.
Above that is the strong resistance at 1.2900 -1.2910 (in red), that the pair pulled back from after several unsuccessful attempts to break out above it.


Friday, February 02, 2018

EUR/GBP Next Week


Today is the end of the trading week and what we can observe on the W1 time frame creates a more realistic expectation about how the EUR/GBP pair (which I also assessed yesterday) will develop.

After reaching the support trend line (in black) this week this pair rebounded from the marked in pink support zone around 0.8730 – 0.8750 and I think it is very possible for it to close as a doji bar above that zone.

The last two W1 time frame bars also hint that that it is very likely for the pair to change directions next week by renewing its rally to the resistance trend line around 0.8950.

In the alternate scenario there will be a breakout below the two support zones (in pink and black), but in opinion that scenario appears less probable.