Tuesday, February 28, 2017

USD/JPY Continues Moving Within A Wide Consolidation


The attempts to move to the upside at the moment are completely in vain and after every small rally there’s a new drop.

The moves to the downside aren’t particularly convincing either and for a month and a half now the pair has been moving within a wide consolidation between 115.60 and 111.60.

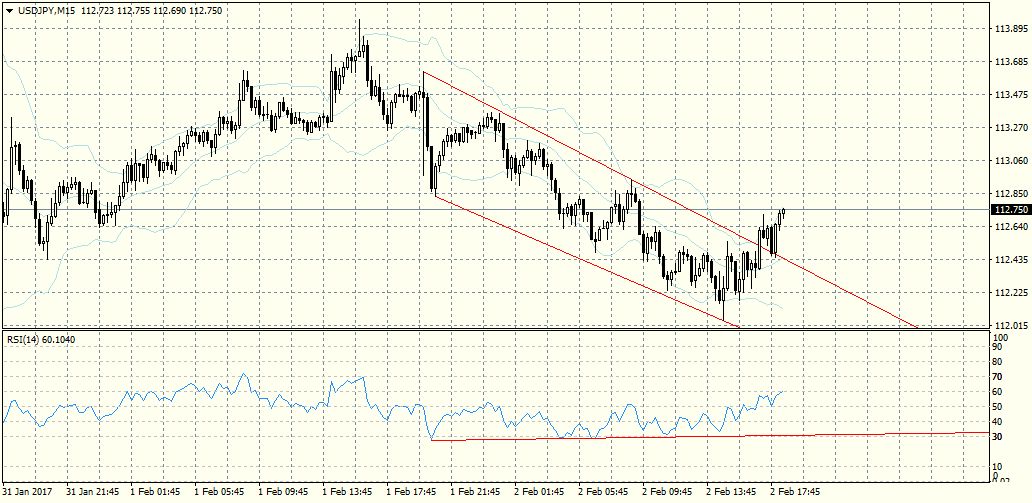
The patterns formed by the trend lines (on the H4 and daily time frame) around the moves to the downside suggest the formation of a wedge (in red) and another, smaller wedge on the smaller time frames (in blue). The critical zone is around 110.80 – 110.40, which is 50% Fibo of the impulse move to the upside from 9th November 2016 to 15th December 2017 (101.190 – 118.660).


It is obvious that the move to the downside is corrective and in my opinion we should be very careful when it reaches the above-mentioned zone around 110.80 – 110.40.

I think it is too early to expect a breakout and to look for a possible limit of those patterns, but we should follow their development closely in order to react on time.


EUR/USD Movement Assessment For This Week


After the drop from the 2nd to the 16th February, when the pair fell from 1.0679 to 1.0498, EUR/USD began again a continuous correction to the upside. Obviously, the pattern it is forming isn’t finished for the moment.

My supposition is based on the fact that the pair has reached the trend lines just three times. As we know, in order for a pattern to be finished and to figure out the limit of that pattern there should be at least four such occasions.

We could suppose that the movement within the channel will lead to another test of the resistance trend line, which means a move to the upside toward 1.0650 – 1.0670.

In the alternate scenario there will be a breakout below the support trend line and another drop, with the first target to the downside being at 1.0550, followed by 1.0500, 1.0450.


Saturday, February 25, 2017

USD/JPY Is About To Reach 111.50 Again


USD/JPY is on its way to reach the key level at 111.50 for a second time. Once it was reached on 7th February 2017 (111.592) and now there’s only 60 pips left until the pair reaches it again.

111.50 is a strong support level – 38.2% Fibo of the impulse move to the upside from 25th September 2016 to 11th December 2016.

Apart from that, the middle line of the Bollinger Bands indicator on the weekly time frame is at that level too and it often is a strong support or resistance difficult to break out below or above.

And last but not least, that level was one of the targets of the RSI divergence of the above-mentioned impulse move to the upside>>>

In my opinion, in the beginning of next week we can expect a correction in the current zone and then a move to the downside toward 111.30 – 109.90, which is the next target of the RSI divergence.


Thursday, February 23, 2017

The EUR/USD RSI Divergence Deepened


As I thought it would in my last  EUR/USD assessment>>> , the pair formed another low, reaching 1.0493, but at the same time the RSI divergence on the M30 time frame deepened.

We can now see a RSI divergence on the longer H1 time frame and it made sense that the pair began a correction to the upside. I should also point out that the H1 RSI divergence has already reached its limit at 1.05774.

For the moment it is difficult to say whether there will be a new, lower low and whether that would be accompanied by a higher RSI low, but let me remind you that the divergence on the daily time frame>>>  reached one of its limits at 1.0744 as EUR/USD formed the pennant and even climbed above it and that we are still waiting for it to reach the rest of its limits, listed in the assessment from 9th February 2016.

In case the pair does continue moving to the upside, I think that in the short-term the first target will be around 1.0625 – 1.0650.

To the downside the target is around 1.0550 – 1.0500.


Tuesday, February 21, 2017

ActivTrades Premium Products: Virtual Private Server


The leading online Forex, CFD and Spread Betting broker ActivTrades offers their clients a number of great services. One of those services is the flexible Forex Virtual Private Server, aka the Forex VPS.

By using the ActivTrades Forex VPS you will enjoy an isolated hosting environment which is excellent for safety and performance purposes.

This VPS is hosted in a secure, redundant data centre, it is optimized to maximize your trading potential and it is available for both Windows and Mac operating systems. The Forex VPS is available to Live Account holders and in order to use it you need to have at least 2500 EUR equity in your trading account.


 What exactly are the benefits of using the Forex VPS?

-Your EA will keep working and running even if you power down your computer.
-The server is exclusively dedicated to EAs and does not run any other applications.
-Safe EA Environment.
-There are no power failures or resets.
-There is guaranteed 99.9999% uptime.
-ActivTrades offers a “Never Reboot” and “Always Up To Date” service protectors.
-10Gbps network connection speed.
-A dedicated IP address is provided.
-DDOS protection.

For more details about the Forex VPS click here>>>


EUR/USD Today


As it could be expected, EUR/USD continued falling and in practice it reached the limit of the pennant that I mentioned on 9th February 2017.

At the same time the pair reached a support visible on the daily time frame and it is possible to form a double bottom there, although to be sure we have to wait for the daily bar to close. For the moment the daily bar is only 8 pips higher than the one on 15th February.


Let’s examine the situation on the smaller time frames.

On M30 time frame the pair appears oversold, RSI is below 20 and there is divergence between two lows.

On the same time frame again we can see a pair of inverted hammer bars, which are at the bottom of the move to the downside and usually they are a signal for a reversal.

The divergence, as well as the inverted hammer bars, are signals for the beginning of a correction and a move to the upside with first target at 1.0550.

Alternately, there could be a new drop toward 1.0520 – 1.0500 and a possible deepening of the divergence, i.e. a new RSI higher low compared to a lower low of the currency pair.


Monday, February 20, 2017

The Forming Flag Patten Is A Signal For A USD/JPY Renewal Of The Move To The Downside


The pair moved to the upside forming a pattern that resembles a flag and reached the support trend line of the channel for a fifth time.

In my opinion, the question is not whether but when there will be a breakout and the pair will renew its move to the downside.

If that breakout occurs in the next hour or two, its first target should be at 36 pips to the downside from the breakout level.

In the alternate scenario the pair will rise toward the resistance trend line and the breakout will be postponed for an uncertain period of time.

Apart from today being a Monday, today is also a holiday in the USA, which is the reason why the market is so sluggish. So we can do little else but be patient and wait for the breakout.


Saturday, February 18, 2017

NZD/USD Is Forming A Strong Bearish Trend


This bearish trend is visible on all time frames, starting with the largest ones.

On the weekly time frame the global bearish trend began on 1st July 2014 and on 23rd August 2015 the pair started a correction that formed a bearish flag (0.63467 – 0.74849). It broke below the support trendline during November 2015 after which the pair retraced back above the breakout within the flag. At the moment NZD/USD is once again at the trend line and we could expect a drop and for it to reach the flag’s limit, meaning that it will fall at least until it reaches 0.65469.

Of course, I do not exclude the possibility for another move to the upside before the pair reaches the flag’s limit, but we can expect it to reach it with considerable certainty.


Considering the way the pair is developing on the daily time frame, however, I think the current move to the downside will continue at least until 0.69986.


On the H4 time frame we can see that there is a possibility for it to form a sideways correction, but since that hasn’t happened yet it can’t be said how it will look like and what level it will reach, if it even begins forming. On that time frame we should observe the 0.71150 level and how the pair will behave around it.


On the H1 time frame NZD/USD is moving within a trend channel to the downside, so I think that the current short-term drop will continue toward 0.7160 -0.7150. As we know, however, even the best trend channel ends sooner or later, which is why we need to watch it closely for a breakout.


Friday, February 17, 2017

EUR/JPY Assessment


The EUR/JPY pair fell at the very beginning of the European session with 80 pips, and it is currently at 120.20. I don’t think that it is very likely for the pair to find local support at 120.40 – 120.50 and to form a corrective pattern above it.

Despite that, considering the two spinning top bars that have gathered below the daily support at 121.00, I think that the possibility for the pair to continue falling remains valid.

My expectation is that the pair will test the last local low at 119.30, which is a strong support level visible on the weekly time frame.

I think there is a large possibility for the pair to break below that support and to continue falling toward 118.50 or even to 118.00 and only then to begin a correction to the upside. However, we need to assess the bars and patterns that will form at that level before we make a prognosis.


Wednesday, February 15, 2017

Strong RSI USD/JPY Divergence Is A Signal For A Drop


The very strong and clear RSI divergence for this pair formed very much on time to signal that the move to the upside is over at this stage. Which, in turn, gave the opportunity to open short positions on time.

As you can see on the screenshot, the divergence is between four main highs, and the limits of these movements are at 112.769, 112.177, 112.001 and 111.758. Which in turn means that we can expect a new retracement almost back to the last low of the wedge at 111.592.


In case the pair continues below that level and forms a new low we should watch out for a deepening of the divergence that signals for a move to the upside, since that has not reached its limit yet, which is at 117.869.

There is also a scenario where the move to the upside will reach its limit, and the divergence signaling for a drop will deepen, so we need to be exceedingly careful.


Tuesday, February 14, 2017

USD/JPY Is Waiting for Economic Data Announcement And Janet Yellen’s Speech To Pick A Direction


A little later today we are waiting for economic data announcement from the USA and after that there will be a speech by FED Chair Janet Yellen - those events will likely give the USD/JPY pair, as well as to many other pairs, a push to pick a side.


Meanwhile, the pair did exactly what I said it would in yesterday’s analysis. The pair formed a small corrective move to the downside, which on one hand aimed to recover the gap, and on the other hand - to reach the resistance trend line the pair broke above, which now has turned into a support.

For the moment, however, one cannot say with great certainty whether the USD will begin moving to the upside after these events, considering the way yesterday’s daily bar closed. The possibility that it will renew its move to the downside seems to be increasing.

If the pair does renew it we can expect it to reach 111.20 – 110.90. In the mean time we should also be watching whether the RSI divergence will deepen, i.e. whether RSI will form a new higher low.
In case USD/JPY renews its move to the upside instead the first target will be around 114.50 – 115.00.


Monday, February 13, 2017

There’s A Breakout Above The USD/JPY Resistance Trend Line And The Gap Hasn’t Been Recovered


USD/JPY broke above the resistance trend line of the last corrective move to the downside from 118.606 to 111.592 and continued rising.


The notable thing is that the breakout occurred through an over 30 pips gap after the market opened today, but the pair made no effort to recover it and continued moving to the upside during the Asian session. That gap still hasn’t been recovered.


Today during the European session the pair tested the trend line it broke above, but immediately rebounded from it.

This breakout and the unrecovered gap, together with the range above the trend line, give me a reason to think that the pair will continue moving to the upside. Before that happens, however, it’s possible for it to fall once again to test the trend line.

I think that the closest target to the downside is at 113.20 – 113.00, and to the upside the short-term target is around 114.50 – 115.00.

Saturday, February 11, 2017

Possible Scenarios For GBP/USD Movements Next Week


The GBP reached 1.25816 and started falling again.

On the daily time frame we can also notice that the current movement is following the middle line of the Bollinger Bands, which is actually a MA20 and the price is often drawn to it during range. We can constantly witness such range in the short, medium and long term.


If we connect the last two lows and the last two highs on the H4 time frame we will end up with a pair of converging trendlines, but whether the pair will follow them in the next few days is up for debate. In case the pair does do that next week it should form a pennant or a flag.

The situation on the chart can lead to four main scenarios for the next week:
-The pair will be slightly bullish but range-bound and will remain within the trend lines (in red) and it will form either flag or a pennant;
-A wide range around the MA20 before the pair picks a direction;
-A move to the downside toward 1.2350;
-Or a move to the upside toward the resistance at 1.27774 (the wide blue line).

However, the last scenario seems to be the least likely one based on the analysis of the charts for the moment, at least for the period between 13th and 17th February.


Thursday, February 09, 2017

EUR/USD Renewed Its Move To The Downside


EUR/USD renewed its move to the downside and if it reaches the limit of the pennant pattern then the pair should fall to 1.04000.

On the other hand, the first target of RSI divergence>>>  on the daily time frame has been reached at 1.07434. The pair has even climbed above it to 1.08285 forming a new high finishing the pennant pattern.

For that reason I have no doubt that the RSI divergence will reach its next targets too. That in turn means that the pair will probably attempt to test the local low at 1.0340 and after that it should renew its move to the upside.

To remind you, the next targets of the RSI divergence are at 1.10119, 1.10431, 1.11402.


Wednesday, February 08, 2017

The GBP Will Probably Test 1.2750 For A Fifth Time


After the sharp drop that occurred during the Asian session yesterday, the GBP/USD pair found a good support around 1.2350 – 1.2400 and climbed with 180 pips at the very beginning of the European one.


After a correction of about 90 pips today the pair found another good support at 1.2475 and continued rising, but until now it has not broken above yesterday’s high at 1.25462. The new high is only three pips higher than the last at 1.25494. Obviously the resistance at 1.2550 is quite strong and in order to continue rising the pair will need to form another correction.

Still, if we examine the daily time frame, we could suppose that the GBP will most likely move to the upside, where the next strong resistance level is at 1.2750. During the five month long range after the big GBP drop on 7th October 2016 that level was tested four times, but GBP/USD still hasn’t broken above it yet.

We are about to find out whether it will remain that way this time too.

Tuesday, February 07, 2017

ActivTrades: Commodities Trading


The leading independent Forex broker ActivTrades offers their clients a large number of instruments to trade with and Commodities are an integral part of those instruments.

Why Commodities trading through ActivTrades is a great idea?

-You have a quick access to the global markets and you can trade Commodities with competitive spreads, beginning with 1 point on the wheat and 0.005 points on natural gas.

-The required margins to open a position are lower than the margins for a Futures contract with leverage up to 1:400.

-The ActivTrades CFD contracts on Commodities have expiry dates and no overnight fees, just as the Futures.

-There are no hidden fees and Commodities trading is available on PC, smartphones and tablets.

For more details click here.>>>


Monday, February 06, 2017

The USD/JPY RSI Divergence Remains Valid Despite The New Low


Although USD/JPY formed a new, lower low at 111.986, it is obvious that the zone around 112.50 – 112.00 remains a very strong support and that the bulls and bears are struggling within it.

At the moment neither can win, so the pair remains undecided and it would be difficult to say what direction it will choose.


Still, we should not forget the fact that despite the new low the RSI divergence remains valid on both the daily and H4 time frames. The last bar that closed on the latter is strongly bullish, which, together with the valid RSI divergence, should be an incentive to remain vigilant and not to overlook a possible move to the upside.

In case the bulls do take control and the pair starts rising, the possible move to the upside could be toward 115.70 – 116.00.

The target to the downside is around 110.50 – 110.00.


Thursday, February 02, 2017

The Expectation for A GBP/USD Drop Became A Reality


As I expected yesterday GBP/USD could not remain above the resistance at 1.2650 and although it reached 1.27057 it then sharply moved to the downside>>>.

The RSI divergence between three highs on the H1 time frame was another signal that the move to the upside would end and that did happen.
In practice, the divergence reached its limit, which was at 1.25326, and at the moment the pair is at 1.25336.

It’s difficult to say what will follow next, since the pair is in a resistance zone visible on the daily time frame.
I think that if the move to the upside is renewed the expectation for it to reach 1.2750 remains valid.

On the other hand, the first support of a move to the downside is in the zone around 1.2430 – 1.2390.


USD/JPY Makes Another Attempt To Break Below 112.00


The USD/JPY support zone around 112.00 – 112.40 turned out to be very strong, because this is the fourth unsuccessful attempt to break below it and although every new attempt forms a new low a few pips below the last one the pair rebounds from it every time.


The last low that formed today at 112.049 was part of a movement within a trend channel that ended with a RSI divergence visible on the M15 and M30 time frames. The limit of that divergence isn’t that large – it’s at 112.545, which means that the pair has reached and surpassed it, so I wouldn’t be surprised if USD/JPY renews its attempts to break below the support zone.

These days the USD is weak compared to most other currencies, which is another reason to expect a renewal of the move to the downside.

Still, if the move to the upside continues I think the pair will rise toward 113.00 – 113.50.

Wednesday, February 01, 2017

GBP/USD Is Bullish For The Moment


Later today, toward the end of the American session, the decision about the US Federal Funds Rate will be announced. Of course, the news could surprise us, but from a purely technical point of view for the moment the GBP/USD pair is bullish.


On the H4 time frame the pair has reached a resistance at 1.2650 and in order to break above it, it will likely need to form a small correction.

I think that if the pair succeeds in breaking above the resistance it will continue moving to the upside toward the next resistance in the zone around 1.2750 – 1.2800. However, that zone could turn out to be harder to break above because the pair has rebounded from it once in December.

Moreover, we still need to see how the market will react to the US Federal Funds Rate announcement. We should also not forget that this pair is influenced by a number of political factors related to BREXIT, which could also cause a surprise so for now I prefer to focus on short-term analyses of it.