Thursday, June 30, 2016

The Uncertainty Continues Today. Price Action Is the Only Way Out


Range continues for most pairs, and traders and investors have a difficult time picking a direction.

Under these circumstances the only thing we can do is trade when there are very clear signals about short-term movements.

I, personally, cannot come up with a different strategy right now.

What do I have in mind?


On most charts you can see a signal that is very clear and appears many times during the day, and it can be traded with a relatively low risk, especially during a bullish trend. I am referring to a candlestick with a small body, a long shadow on the bottom and a very short shadow on the top, which we know as a hammer or a pinbar candlestick. Such a candlestick that has formed above a support level is a great signal to open a long position. Usually the larger the time frame the candlestick appears on, the more long-term the signal it provides is. You can find such candlesticks both on the 5-minute and the 4-hour time frames.

Here you can see a few examples of such setups.


There are many other setups based on the price action strategy, but they are much more complicated than that, which is why I am not writing about them in this post. The pin bar (or the bullish hammer) is the most popular signal, as well as the most easily recognizable one, which is why I decided to write about it.


Wednesday, June 29, 2016

After Brexit Most Instruments Are Trying to Find a Direction


The news that the UK will leave the European Union caused chaos and panic on the financial markets, and they still cannot recuperate from that.

Most instruments (currency pairs, metals, commodities, indexes and stocks) are in range that has continued for almost a week now.

The markets are trying to find a direction and at the moment it is unclear whether that will happen anytime soon, especially considering the fact that whatever decisions are made will be made in September at the earliest, because yesterday the EU gave London a two months respite to make the first steps to leave.

Not to mention that respite coincides with the summer season, which is at the beginning of its height in the Northern Hemisphere, and during this period the markets are generally a lot less volatile.

With all this in mind I would say that traders are facing a lot of uncertainty during this summer and in my opinion it will be best to do intraday or very small time frame trades. At the moment it is very hard, even almost impossible to make a long-term prediction about the direction of the various instruments.


Tuesday, June 28, 2016

ActivTrades Autochartist – an Invaluable Tool for All Traders


Autochartist is one of the best intraday trading tools on the market. If you are interested in and practice technical analysis as part of your trading approach, this tool is an invaluable aid, regardless of your level of experience, as it can help you identify emerging and completed chart patterns, Fibonacci patterns and key levels, which Autochartist identifies automatically as either “Breakout” or “Approach”, as well as power stats, providingtraders with relevant price movement of all instruments.This helps traders by providing a clear assessment of risk and volatility

The competitive online broker ActivTrades recently released an improved version of this powerful trading tool and is offering its clients a free subscription for its services.  I highly recommend using Autochartist, as its functions would inevitably boost your confidence as you decide what and when to trade.


Saturday, June 25, 2016

USD/JPY – Is it Time for a Wave B?


I have written several times on the topic of the USD/JPY correction and I have said that I expect about 50% drop from the impulse move to the upside that lasted for three years.

The news that the British people have voted for the UK to leave the EU had a dramatic effect on the market and caused great movements in almost all currency pairs and indexes. USD/JPY, which is one of the most popular currency pairs, is no exception and after the results of the referendum came out it dropped sharply with over 800 pips. That, in turn, formed the expected wave A of the correction, which reached 50% Fibo.

I think that that pair might test the already reached low at 98.814 again, but I expect that this would be the beginning of wave B.

Not to mention that there are multiple media reports that almost a million people have signed a petition to organize another referendum. Such a petition will inevitably be discussed by the parliament and I think should there be a new referendum the market will obviously go in another direction, this currency pair included.


Friday, June 24, 2016

The Unthinkable Happened


Even yesterday no one could believe that the British voters would choose to leave the European Union.

Everyone thought that such a move was unthinkable and investors were favouring the long positions for the GBP. Unfortunately, towards the end of the day the enthusiasm drained away and in its place panic set in, after which the GBP started crashing.

The British currency dropped with 1800 pips for eight hours, reaching the historical low at 1.3226, which is its lowest level since 1985.

It is difficult to say what we can expect from now on. At the moment the chart is not offering any sort of technical analysis clarity, nor are the markets offering any fundamental analysis clarity. I hope that in the following days things will become clearer and we will be able to find new entry points for this currency.


Wednesday, June 22, 2016

In the Eve of Brexit EUR/USD Is Barely Moving in a Tight Range


Tomorrow is the big day that everyone in the EU, and frankly, many people outside of the EU, have been anxiously expecting for a long time now. What will be the British people’s choice?

Will they remain a part of the big European family or will they leave it? There are thousands of articles and comments made in all media about this.


I think that to attempt to make a technical analysis of EUR/USD as well as other EUR and GBP pairs is pointless today.

Tomorrow the movements of these pairs will be decided by the voters.

All we can do right now is to wait and see what the British citizens will decide.

In my opinion, there will be massive volatility in both directions.
I, personally, will refrain from trading and instead I will relax for a day while waiting for the market to decide on its direction. I wish everyone who do intend to trade success and I hope you will be careful while doing that.


Tuesday, June 21, 2016

A Trend Reversal for Gold?


Gold formed a third consecutive high visible on the weekly time frame for the period between 12th and 19th June and by doing so it also reached 75% of the limit of the wedge that has been forming in the past two years – between December 2013 and December 2015. It is well-known that such technical analysis figures may not always reach 100% of their limits, but it is normal to expect them to reach least 70%. With this in mind I can say that Gold has reached that 70% minimum.

The third consecutive high is also a shooting star candlestick, which has formed below the weekly resistance at 1300.

Also, the RSI indicator shows a very clear divergence between these three highs.

What is more, on the weekly time frame we can see a broadening triangle with four waves that have formed so far. It remains to be seen whether the fifth one will form as well. Such broadening triangles are often signals for a trend reversal.

With all these factors in mind, as well as the fact that signals that appear on the weekly time frame are pretty long-term, I wonder whether Gold will continue rising or we will see a new move to the downside. I am willing to accept the latter scenario, but time will tell whether I am right.

Monday, June 20, 2016

USD/CAD Will Likely Continue Falling towards the Zone around 1.2720 – 1.2710


As I examine the trendlines as well as the support indicated by Bollinger Bands on the four-hour time frame, I think that the pair retracing to the upside is perfectly logical.

You can see several trendlines on the screenshot, and the two inner ones make me think that there’s a large possibility that we will see a figure that graphical analysis calls bump and run reversal forming soon.


The retracement to the steeper trendline (the blue one) also makes me think that the pair will very likely continue falling.

USD/CAD still hasn’t reached the main trendline (the green one) that connects the lows on the 3rd May and 8th June and so far there is no indication that the pair won’t reach it.

Taking all this into consideration, I think that the logical approach to trading this pair is to sell at every retracement to the upside.


Saturday, June 18, 2016

Gold’s Next Target is $1405


The wedge that we can observe on the weekly and the monthly time frames has been forming for exactly two years – from 1st Dec 2013 to 1st Dec 2015 and it is rallying towards its limit, which is at the $1405 level.

Let me explain how I calculated this target: the width of the wedge (i.e. the distance between its highest and lowest points) is projected north of its lowest point. In this case, that projection points to the $1405.

And although at the moment Gold has reached the resistance between $1290 and $1300, I have little doubt that the wedge will reach its limit around $1400 - $1405 before we see a deeper correction to the downside.


Friday, June 17, 2016

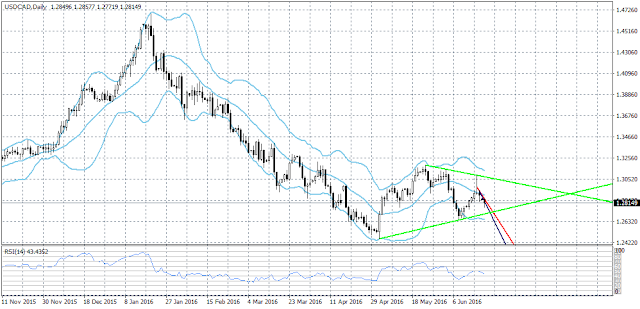
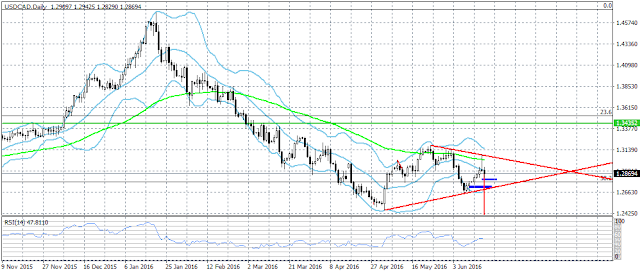
There’s a Great Doji Candlestick on the Daily USD/CAD Chart


Although USD/CAD rallied it could not reach the target at 1.3130 as I thought it would, it could not even reach 1.3100, as it stopped 15 pips below that level and started a sharp move to the downside.

This move to the downside formed a great doji candlestick that closed below the middle line of the Bollinger Bands indicator on the daily time frame.

Today the pair continued falling, reaching a low at 1.2829.


I think that the pair will continue falling and the two closest support zones it could reach are the one between 1.2810 - 1.2790, and the one between 1.2730 – 1.2700, as you can see on the screenshot.

Above all else, however, we need to see how the daily candlestick will close today. If the candlestick closes below 1.2861, the possibility to see a further move down next week increases immensely. The alternate scenario is that there will be a retracement to the upside before the pair continues falling.


Thursday, June 16, 2016

USD/CAD Disappointed All Expectations for a Drop and Started Climbing towards 1.3100


The news that came out yesterday that the US Federal Funds Rate would be kept as kept as it is, together with the hint dropped by the FED Chair Janet Yellen that we can expect a rate hike in July did not have a negative influence on the US dollar, on the contrary, it made it soar.

At this point it is more than obvious what is the USD/CAD next target – the pair is climbing towards the resistance at 1.3130, which can be seen on the weekly time frame.


What is more, after yesterday’s news the pair managed to break above the trend channel in which it had been moving and started climbing unwaveringly towards its target. If it does manage to reach it then the double bottom that can be seen on the four-hour and daily time frames would be a signal for a 500 pips move to the upside.


Tuesday, June 14, 2016

ActivTrades Innovation: A Metatrader Suite


The Metarader trading platforms are the most popular, the most versatile trading platforms on the market.

Different brokers offer their versions of some of them, but only ActivTrades offers its clients everything Metatrader has to offer: MT4, MT5 and the Metatrader 4 Web.

And now the company is organizing a free webinar that will be led by professional trader Malte Kaub, who will help you learn the differences between these trading platforms and how to harness the power of market leading trading package.


The webinar will be held on 16th Jun.

For more information and to register for it follow this link>>>

All ActivTrades webinars are free and open to the public.


Monday, June 13, 2016

The USD/JPY Correction to the Downside Continues


If we examine the screenshot of the monthly time frame we can conclude that the pair has not finished the first (A) wave of its correction.

I think the move to the downside will possibly continue until the pair reaches 104.00 (which is 38.2% Fibo of the move to the upside) or even 101.50 (which is 50% Fibo).

Despite all this the scenario that there will be a move to the upside for wave B remains valid.

The corrective trend on itself, as it is usual after an impulse according to the the Elliot Wave theory, consists of three waves and it could continue for two more years, while the overall move to the downside could continue until the pair reaches 95.00 (61.8% Fibo) or even lower.


Saturday, June 11, 2016

EUR/AUD – A Sideways Consolidation and a Triangle


For now it is not clear whether the triangle that is forming on the one-hour and the four-hour time frames is the end of the range and whether there will be a breakout of either of its trendlines.
I am saying “either”, although if we look at the four-hour time frame it appears that the breakout will be to the downside.


We need to be careful, because on the daily time frame it’s obvious that the pair is at a strong level of support, so it is possible that the range will last a while longer.


Still, if there is a breakout it’s possible for the move to the downside to continue to the critical zone that is visualized by a blue rectangle. The weekly time frame confirms the possibility of that scenario.


Friday, June 10, 2016

A Double Bottom and a Strong Move to the Upside for USD/CAD


After the sharp move to the downside today caused by the optimistic employment change and unemployment rate data, the USD/CAD pair predictably began moving to the upside. More importantly, the pair also formed a double bottom visible on the four-hour time frame, which is also visible on the daily time frame, as well as a great hammer candlestick on the aforementioned four-hour time frame.


At the moment the pair is rising towards the resistance at 1.2800, but I think it will possibly reach 1.2850 or even climb higher than that.

It is still difficult to predict whether this is the end of the bearish trend or this is the beginning of a corrective flag, but next week it will likely become obvious which one of these scenarios is more valid.


Thursday, June 09, 2016

NZD/USD Formed a Signal for a Move to the Downside


The announcement of the rate statement of the Reserve Bank of New Zealand had a great effect on the market.

Although the bank did not change the interest rate, the NZD/USD pair formed a 40 pips bullish gap, and the overall move to the upside lasted for 130 pips.

Today there is a real chance for this gap to be recovered, and at the beginning of the London session the pair had good signals for short positions.

On the four-hour time frame there are two spinning top candlesticks, and on the one-hour time frame there are two candlesticks forming a tweezer top.


Those candlesticks were a signal for a move to the downside and that move began at the start of the London session.

With that in mind I expect that the pair will recover the gap.
As for the longer term prognosis – on the larger time frames the pair is forming a slightly bullish sideways consolidation, so we need to keep our eyes open to see in which direction there will be a breakout.

Wednesday, June 08, 2016

CAD/JPY – A Triangle Breakout


The triangle breakout and the pair retracing to test the trendline again are offering an excellent opportunity to open long positions when we see a signal for a move to the upside again.

I have already analyzed this situation theoretically in a previous post>>>  and now we have the opportunity to use this analysis in practice after the pair broke out above the triangle.

CAD/JPY climbed with 40 pips after the pair broke above the resistance trendline, which gave the traders with a more aggressive trading approach an opportunity to profit from that breakout, after which the pair retraced back to the trendline to test it again, which is really a textbook example of this pattern.

It is logical for the new move to the upside to be around 80 pips (which is the height of the triangle, i.e. that is the distance between the lowest level and the level of the breakout of the triangle), in other words, next target is around 84.94.


Tuesday, June 07, 2016

EUR/NZD Is Forming a Triangle on the Daily and Weekly Time Frames, which Is a Signal for a Good Profit


I really love triangles, because they are patterns the limit of which is easy to figure out after a breakout.
One such triangle, which in my opinion is a good idea to observe, seems to be forming on the daily time frame of EUR/NZD. The same pattern is also visible on the weekly time frame.

Of course, before we can trade that triangle we will have to wait for a breakout in either direction, but that alone is not enough. Usually, when we have a triangle and a breakout, the pair retraces back to the breakout to test that level before continuing in the direction of the breakout and that is the best moment to open a new position.

If we watch the EUR/NZD pair and wait until this moment we will have the chance to trade at least 140 pips, i.e. the height of this triangle starting from the breakout level.


Friday, June 03, 2016

USD/CAD Is Falling Toward 1.2850, as I Thought It Would


The announcement of the NFP data was the catalyst that sent the pair falling down towards target 1.2850 – 1.2800.

By the way, this move to the downside has been expected for the past seven days and I wrote about it yesterday, 2nd June>>>  – and I did not have to wait long for my analysis to come true. The news caused the pair to fall with over 170 pips for less than 30 minutes.

What can we expect next? As usual, there are two probable scenarios.

In scenario number one, the pair will continue dropping, at least until it reaches 1.2700 – 1.2690, in scenario number two we can expect the pair to start rising again once it reaches the zone around 1.2850 - 1.2800.

Don’t be upset if you haven’t been able to trade the drop. It is reasonable to expect the inevitable correction that will likely happen before the market closes today or in the beginning of the next week, which will give you the opportunity to open new short positions. After all, there no less than 80 pips which can be traded until the pair reaches the target.


Thursday, June 02, 2016

The USD/CAD Range Has Lasted for 7 Days. In Which Direction Will the Breakout Be?


The USD/CAD pair has been undecided for seven days now and has been moving in a relatively wide, slightly bullish range.

If we look at the candlesticks on the daily time frame we’ll see that they are either doji or spinning tops and none of them have succeeded in breaking above the (EMA)89  indicator (the green line). The range has formed between said (EMA)89 indicator and the middle line of the Bollinger Bands indicator and it very much reminds me of a bar formation that Al Brooks calls “barb wire”. The definition of “barb wire” is “three or more bars that overlap each other and one or more of them are doji”.

In this case I expect a move to the downside towards 1.2850 – 1.2800 due to the following principle: we can expect as big of a drop as the one that preceded the barbed wire formation. In this case the drop that preceded it was 285 pips, which means that 1.2850 is the likely target of the expected move to the downside.

Of course, there’s a possibility this scenario might not be valid, in which case the pair will climb towards 1.3280, which is a strong weekly resistance.


Wednesday, June 01, 2016

AUD/USD Started Climbing after Forming a Double Bottom


What is it that we see on the screenshot? On the four-hour time frame there is a very well-formed double bottom, as well as an obvious resistance level at 0.72986, which the pair has tested twice but has not been able to break above.

The pair has risen with 154 pips after the double bottom until it reached the resistance at 0.72986. When there is such a double bottom, followed by such a strong resistance level we can expect that the pair will climb another 154 pips starting from the resistance level at 0.72986 if it breaks above said level, which means it will reach at least 0.74526.

My expectation is that we will see this move to the upside in the next few days.