In my last
post I promised that I would elaborate on the good entry points for opening new
positions, but those entry points will be about USD/CAD, which I followed and
traded today.
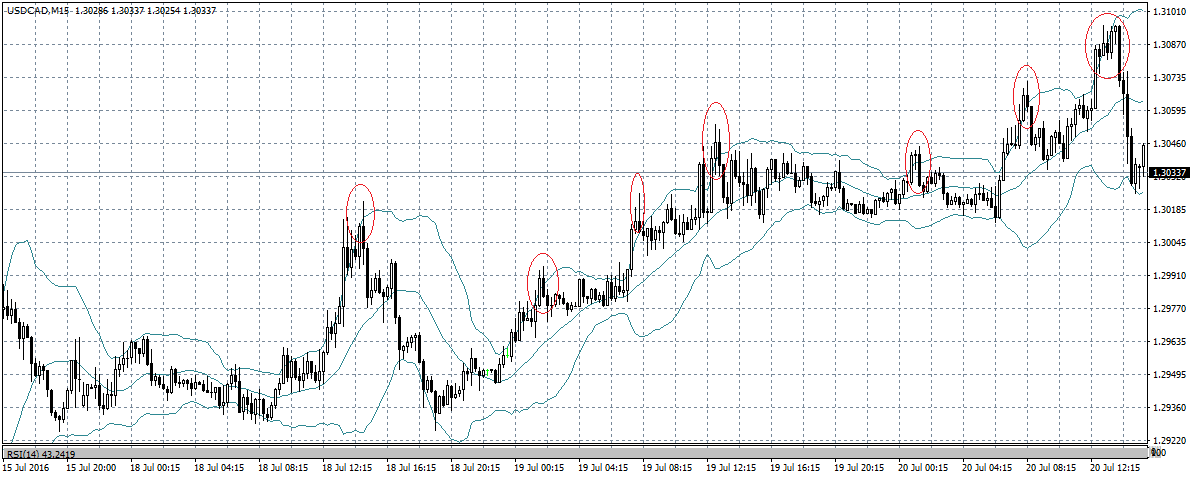
Today there
were two reasons to open long positions for this pair:
The
first reason was
that that pair formed a double bottom, as the second low was a little higher
than the first one at 1.29258, while the second formed at 1.29316 and there was
a doji candlestick on the one-hour time frame as well. After that the pair
started rising.
After the
pair reached 1.29609, it rebounded from the resistance there and formed a small
inside bar on the one-hour time frame, while the bar after it was a doji with
long upper shadow.
The
situation in the 5-minute time frame, where we can see how that doji formed,
was even more interesting. We can see that the 1.2942 level is a support – the
pair has bounced off of it four times while forming a horizontal range, after
which it continued climbing towards 1.30217.
The
second reason for
opening a long position was that, as we know, corrective waves never form by
themselves. They form at least in pairs, and when USD/CAD reached 1.29871
yesterday only the first wave after the drop in the previous days had formed.
Whether
this is the end of the move to the upside is not clear yet, but either way, the
pair reached a strong resistance zone around 1.30000 both on the four-hour and
the daily time frames.
I will elaborate on what I think will happen next in a following post.
I also want to mention that my thoughts are not signals to open new positions. Their purpose is rather to teach the less experienced traders to examine the charts carefully and to “read” the signals the pairs form there on their own.


