
The only difference is in the duration and the depth of the correction in terms of pips. In this case we are examining the monthly time frame, which explains the considerable rebound – 270 pips until now.
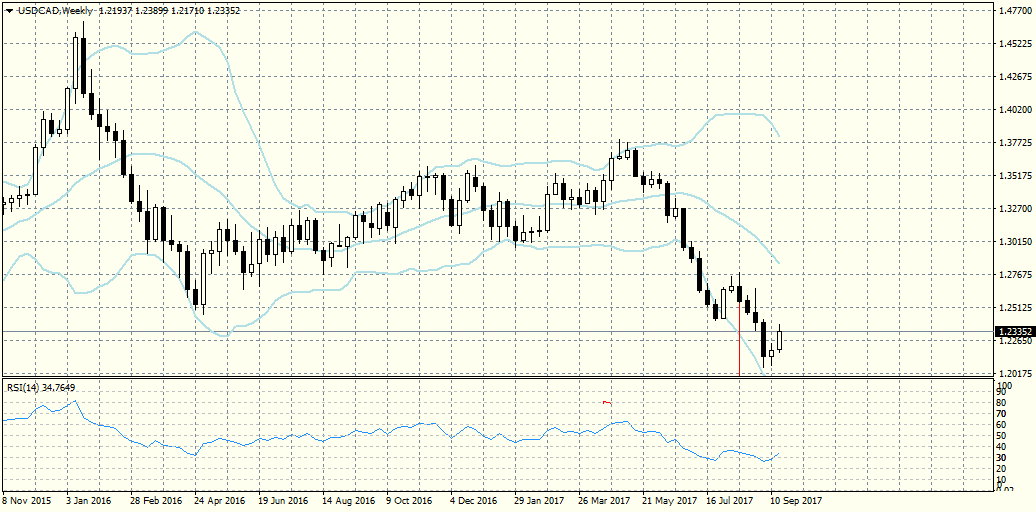
If we examine the W1 time frame, we will notice something both interesting and important: at the bottom of the move to the downside there is a spinning top bar, which is a strong signal for a reversal.
In my opinion, 1.2430 – 1.2450 is the first target of the rally. In case USD/CAD continues moving north we could expect it to reach 1.2550 - 1.2600.
Good insight.
ReplyDeleteThank you for the analysis.
ReplyDeleteGreat assessment as always!
ReplyDeleteGood point! I´ll be watching to those levels.
ReplyDeleteAccurate analysis.
ReplyDeleteVery nice tip I'll be watching.
ReplyDelete