After a week of focusing on The Turtle Experiment, which is an interesting and exciting part of the history of Forex trading, this week I decided to return to the analysis of one of my favourite currency pairs so let’s examine what is happening on the market.
I am looking at the USD/JPY charts and what I am seeing convinces me yet again that the Japanese candlesticks patterns should be followed without a doubt.
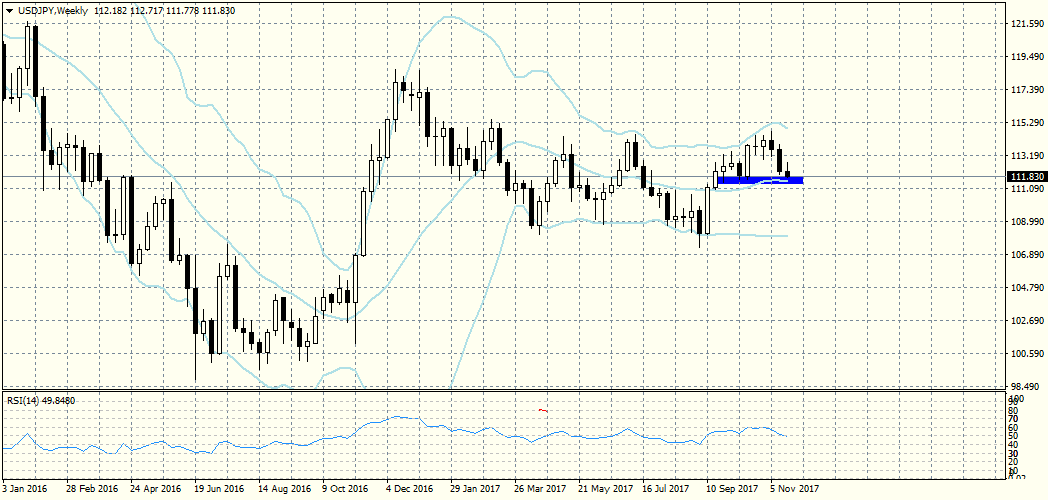
On the W1 time frame USD/JPY has formed three bars under the resistance at 114.80 – one doji and two spinning top bars, which were a signal for the current depreciation, which is now a fact.
The pair reached the zone of the first serious support around 111.80 – 111.40. In case there is a breakout I think we will see a drop to the support of the range around 108.000 – 107.000.
The candlestick pattern on the W1 time frame is a signal for just such a drop.
It really is quite bearish.
ReplyDeleteI fully agree with your assessment.
ReplyDeleteTaking note of key levels to keep track and follow up.
ReplyDeleteGreat assessment. I'll keep a close eye on it.
ReplyDeleteGood post!
ReplyDeleteGood insight.
ReplyDeleteVery good analysis.
ReplyDeleteCongratulations for your accurate predictions.
ReplyDeleteAccurate analysis.
ReplyDelete