
The GBP reached 1.25816 and started falling again.
On the daily time frame we can also notice that the current movement is following the middle line of the Bollinger Bands, which is actually a MA20 and the price is often drawn to it during range. We can constantly witness such range in the short, medium and long term.
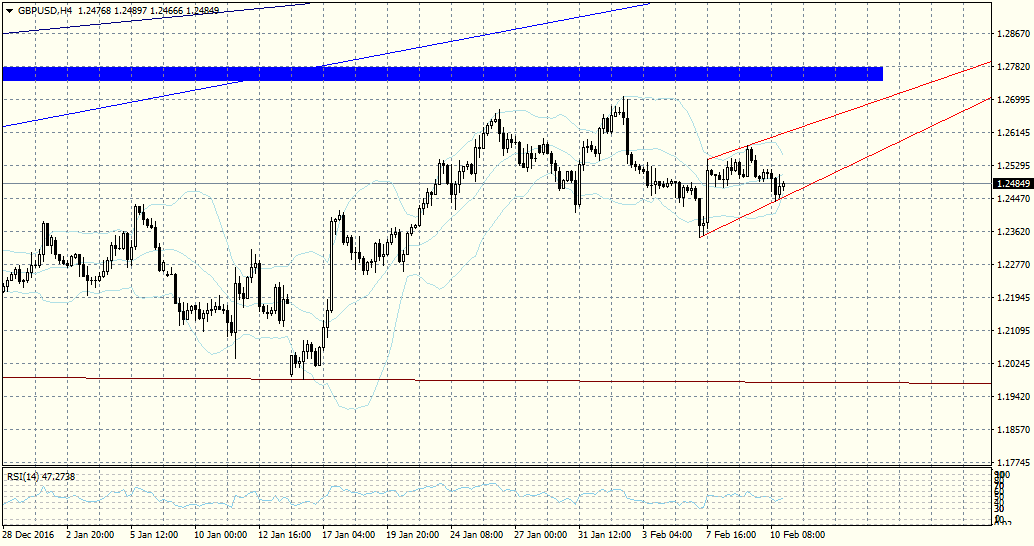
If we connect the last two lows and the last two highs on the H4 time frame we will end up with a pair of converging trendlines, but whether the pair will follow them in the next few days is up for debate. In case the pair does do that next week it should form a pennant or a flag.
The situation on the chart can lead to four main scenarios for the next week:
-The pair will be slightly bullish but range-bound and will remain within the trend lines (in red) and it will form either flag or a pennant;
-A wide range around the MA20 before the pair picks a direction;
-A move to the downside toward 1.2350;
-Or a move to the upside toward the resistance at 1.27774 (the wide blue line).
However, the last scenario seems to be the least likely one based on the analysis of the charts for the moment, at least for the period between 13th and 17th February.
Useful iinformation, thank you!
ReplyDeleteThank you for the detailed analysis.
ReplyDeleteExcellent Analysis! Thanks.
ReplyDeleteGreat article as usual.
ReplyDeleteThank you for the analysis very helpful.
ReplyDeleteGood insight.
ReplyDeleteExcellent analysis.
ReplyDeleteGood post.
ReplyDelete