
The general rule is that when the price moves outside the Bollinger Bands the trend tends to continue. We can use this characteristic of the indicator to make a judgement about the market direction – when the price is touching and breaking above the upper band, the trend is bullish. When the price is touching and breaking below the lower band – the trend is bearish.
Sometimes,
however, the price breaking out outside the bands means that there is a false
breakout – i.e. the price has tested a level and then it has retraced from that
level. In those cases one has the opportunity to open positions against the
trend, but one should always be careful to make sure it really is a false
breakout. One should also always keep in mind that trading against the trend is
a trading approach that should be attempted by experienced traders. If you
don’t feel that you have enough experience to do that, don’t try it.
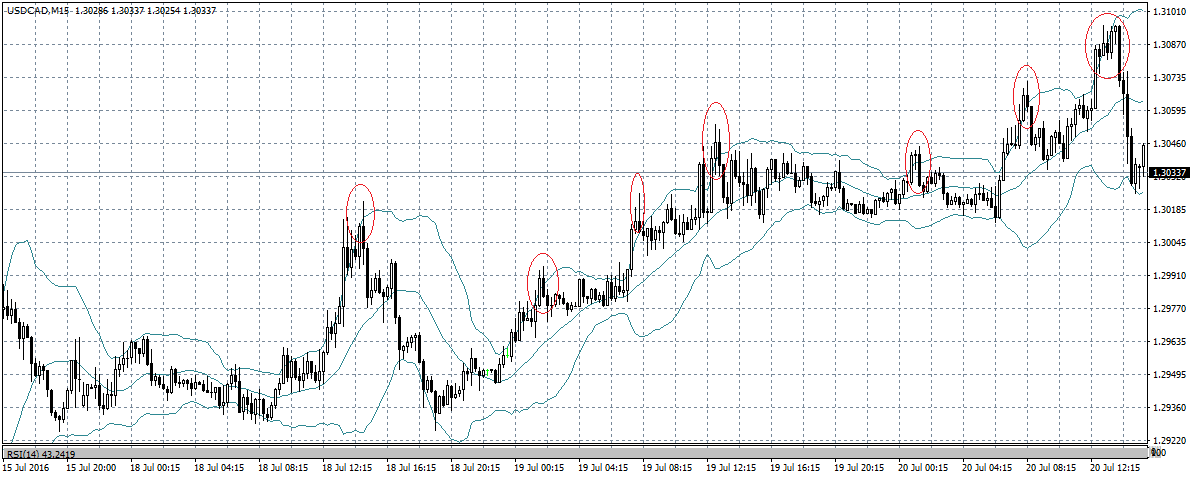
On picture 2 you can see a few of these trading opportunities.
They are usually
characterized by a sharp breakout outside the Bollinger Bands and they tend to
be very visible.
Very useful information.
ReplyDeleteGreat post, very educational.
ReplyDeleteGreat post as always.
ReplyDeleteGood analysis!
ReplyDeleteThat's very useful information.
ReplyDeleteHelpful article!
ReplyDelete