Showing posts with label forex. Show all posts

Wednesday, August 15, 2018

A USD/JPY Assessment


The pair reached the diagonal resistance trend line of the wide trend channel in which it has been developing since December 2016, but it made no attempt to break out and renewed its depreciation.


The depreciation could be just a test of the support at 110.50 in order for the pair to gather liquidity before it attempts to break out above 111.20. The alternative scenario is for a continuation of the depreciation toward 110.20 – 110.00.

The most extreme scenario is for the breakout above the red trend line to have been false and for the USD to continue falling, moving within the red trend channel.

We could think about a long term rally only after a breakout above the red trend line, a breakout above 111.20 and if the pair remains above that level.


Tuesday, August 14, 2018

GBP/USD May Consolidate Before It Continues Dropping To The Next Support


The support at 1.2720 stopped the depreciation of the pair, if only temporary. After the pair rebounded to 1.2870, which is practically the first resistance level to the upside, today the GBP returned toward the support at 1.2720.


It is more than clear that the move north was corrective, but I suppose that the pair will consolidate between the abovementioned levels for a little while longer. There may be a test of the resistance levels at 1.2850 and 1.2920, which is made clear on the H4 time frame.

On the larger time frames, however, the pair remains very bearish, and the next support zone toward which the pair should head for after the end of the correction is around 1.2600 – 1.2570.

The alternative scenario is for a continuation of the depreciatin without a deeper correction.


Friday, August 10, 2018

The USD/JPY Depreciation Continues Toward The Support Zone At 110.20 – 110.00

The pair continues moving slowly and correctively within an unbroken trend channel toward its first target to the downside, which is the support zone at 110.20 – 110.00.


I think that despite the slow and very hesitant move south the depreciation may reach 109.60 – 109.40. That is the zone within which the USD could find strong support and from there it could renew its upward trend.


The alternative scenario in case there is a breakout below that support is for the pair to continue depreciation. For the moment that scenario appears less probable, not to mention that the USD remains exceptionally strong against all other currencies – so much so that its weakness against the JPY causes confusion.

For the moment we can expect the depreciation of the USD to the first support at 110.20 – 110.00.


Thursday, August 09, 2018

The Existing Downward Trend Would Lead To A Break Out Below 1.1510


The pair tested firmly the break out below the trend line (in light blue) and in the moment it is trading in a consolidation between the trend line, which has become a support and the dynamic  support above 1.1570.


If we examine the D1 time frame we could say with certainty that the trend is firmly bearish. Now we have to see whether there will be a breakout below the support at 1.1570 until the end of today’s American session or the pair will close the D1 bar once again below the diagonal support as well as the kind of bar it will form when it closes.

In my opinion, in case the pair does not manage to break out below 1.1570 the bar may be a doji or a spinning top, after which the pair will test 1.1510 and if it breaks out below that level it will head for 1.1300.

The alternative scenario is for a rally to 1.1700 and 1.1750.


Saturday, August 04, 2018

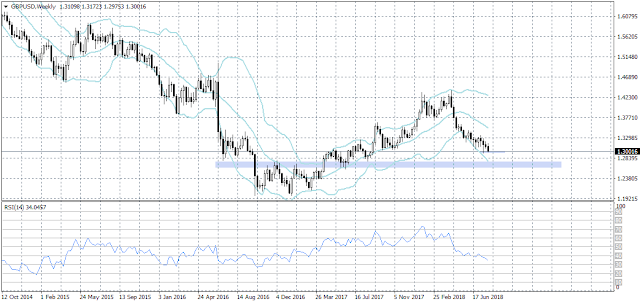
The GBP/USD Downward Trend Should Continue


The pair entered the support zone around 1.3020  -1.2990>>>  and I think it should begin a correction to the upside.

Unfortunately, I also think the butterfly won’t reach its limit completely, the downward trend is very strong and the pair appears to be heading inexorably to the downside to test the historical low at 1.1986 from 1st January 2017.


A signal for a renewal of the downward trend would be the breakout below the RSI divergence on the D1 time frame.

If the pair breaks out below the support around 1.3020 – 1.2990 we could expect the next strong support zone for the GBP to be the zone around 1.2750 - 1.2650.


Friday, August 03, 2018

We Should Expect An End Of The EUR/USD Consolidation And A Breakout Below 1.1510


I think that at this stage we should give up on the idea for a rally to 1.1800 – 1.1850, let alone toward 1.2000.

The pair has been forming a sideways consolidation for two and a half months. The fact that that there was a breakout below the symmetrical triangle that I drew in a previous post  as well as the fact that the consolidation that lasted for ten weeks did not remain above 1.1710 for long should point us to the expectation for an end to that consolidation and a continuation of the downward trend.

I think that every rally should now be viewed as corrective, as gathering of liquidity and an attempt for a drop below the local low at 1.1507, which should open the way to 1.1350 –  1.1300.


Thursday, August 02, 2018

There Are Two Scenarios For The GBP At This Stage

The hike of the interest rate of the Bank of England and the monetary policy report not only did not have a positive influence on the GBP, which, instead of rallying, it fell compared to the USD with almost 110 pips and has almost reached the support zone around 1.3020 – 1.2990>>>  as I thought it would last week.

At the same time the RSI divergence on the D1 time frame remains at this stage.

I think that now there are two scenarios for further development:

The first scenario is for a test of the local low at 1.2957, a formation of a double bottom and then a trend reversal with a target at 1.3570.

The other scenario is for a breakout below the local low and a continuation of the depreciation toward 1.2750 – 1.2700.


Wednesday, August 01, 2018

The Market Expects The Announcement Of The FED Interest Rate


That announcement will come out later today and the markets are, as expects, consolidating while waiting for it.

Preliminary data suggests no change in the interest rate, although surprises are always possible.

Yesterday the USD/JPY pair rallied with over 150 pips (from  110.74 to 112.14), after which a new butterfly pattern was formed on the H4 time frame, which hinted that the drop is impending, but the USD won’t begin depreciating before the news come out.

I think the pair will fall at least toward the main trend line of the upward trend (in dark blue).
In case of a breakout the drop could last to around  110.00 – 109.50.

The alternative scenario – in case the trend line holds, is for a renewal of the upward movement of the USD.


Monday, July 30, 2018

I Expect A Breakout To The Upside And An EUR/USD Rally To 1.20+

I expect the consolidation to end soon and for the pair to finally pick a direction.

A clear symmetrical triangle with a height at its base of 325 pips - from 1.1851 to 1.1507 - is forming on the H4 time frame.

The breakout of that triangle is impending and if it is above the resistance trend line then we can expect a rally to 1.20+.

The alternative scenario is for a breakout to the downside, below the support trend line, after which I think there will be a depreciation toward 1.1300 – 1.1280.

I think that the more probable scenario is for a rally toward 1.20+, after which we should be looking for an entry for medium term short positions.


Saturday, July 28, 2018

GBP/USD Will Test The Support In The Zone Around 1.3020 – 1.2990

The behavior of the pair clearly shows that it may test the support in the zone around 1.3020 – 1.2990 which has been marked on the D1 time frame.

The RSI divergence on the D1 time frame remains valid for the moment, but I expect that during the move to the downside the indicator will test its trend line marked on the same time frame once again.


After that there are two possible scenarios to keep in mind: if the support holds the pair will begin moving to the upside to reach the limit of the butterfly pattern and the limit of the divergence>>>

Next week we will find out which scenario the market will pick.


Thursday, July 26, 2018

The EUR Continues Developing In A Relatively Tight Consolidation

It’s becoming clearer and clearer that EUR/USD is forming a sideways correction within a rather vague trend channel which can hardly be called anything – it’s neither a flag, nor a pennant. To characterize it as a flag the pair should rally to 1.1850 – 1.1870, i.e. to the resistance trend line of the channel, but so far that has not happened.

Today the ECB announced its interest rate and there were no changes, but the press-conference of its Governor Mario Draghi gave traders good opportunity to begin selling the EUR massively, and the pair dropped from 1.1740 to 1.1650.

Still, until there is a breakout below the support trend line, we could expect a rally. I doubt that the pair will rally much more though. In my opinion, if it reaches the resistance trend line short positions should be in order, and in case there’s a breakout below the support trend line the depreciation could reach 1.1350 – 1.1300.


Wednesday, July 25, 2018

I Expect GBP/USD To Rally To 1.3362


My first argument in favour of that expectation is the Pesavento butterfly that appeared on the H4 time frame. The harmonic pattern fits all conditions, the mandatory of which is the level of point B compared to the XA ray: 0.786. The pattern fits the rest of the conditions for the formation of the A, C and D rays. The target of the butterfly is point A at 1.3362.


My other argument is the RSI divergence on the D1 time frame between three lows compared to the price, the limit of which is at 1.3395 and is higher than point A.

If the pair cannot break out above the dynamic resistance at 1.3180 it could depreciate toward 1.3080 - 1.3040 to gather liquidity to test the resistance in the zone around 1.3370 – 1.3380 after which it will continue rallying to reach the target of the Pesavento butterfly.