Showing posts with label EUR/JPY. Show all posts

Saturday, May 12, 2018

The EUR/JPY Double Bottom Is A Signal For A Possible Rally


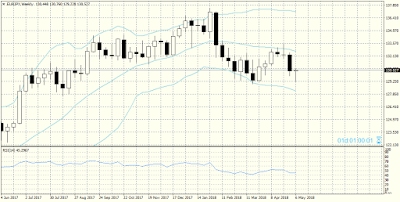
The double bottom can be seen on the D1 time frame (128.944 on 22nd March 2018 and 129.28 on 22nd May 2018).

Apart from that the last weekly candle is a pin bar, which confirms the scenario for a rally of this pair.

If this is a valid scenario, we could expect a move north to the first resistance at 131.50, followed by another rally to 132.50. If the pair breaks out above those resistance levels, we could expect a move up to 133.50.

Under any circumstances, however, this will be a corrective rally. To the downside there is a strong support around 127.00 and I think the pair will reach it once it’s done with the possible correction to the upside.


Wednesday, April 25, 2018

I Expect An EUR/JPY Drop


EUR/JPY could not quite reach 133.50 and it stopped at 133.64, a level from which I expect the beginning of a correction.


For the moment the pair is range-bound within the zone around 132.80 – 133.00 which is a rather strong local support zone (best seen on the H1 time frame) and if there is a breakout below that zone we could expect a drop to 132.50 where is the next strong support zone.


If the pair breaks out below that too we could expect the depreciation to continue toward 132.00 and 131.50.

In the alternate scenario the pair will rally, but that scenario could develop only after a breakout above the strong resistance at 133.50.

Saturday, April 21, 2018

There May Be A Wide EUR/JPY Consolidation Next Week


On the monthly time frame the pair is between the strong support at 122.60 and the resistance at 137.00.


On the W1 time frame the pair is below the strong resistance at 133.00 and it is very probable for the pair to consolidate below it for a while before it continues falling.


On the D1 time frame the pair appears bearish and the first strong support is at 131.00 – 131.50.


On the H4 time frame, however, the pair has also reached a support level and it has closed the last two bars as spinning tops. That is a rather unambiguous signal that before the depreciation continues the pair will form a bullish correction with the expectation to reach around 132.50 – 132.60.


Saturday, February 10, 2018

EUR/JPY In The Next Few Weeks


EUR/JPY reached the limit of the multi-day range between 131.40 and 134.40, as you can see on the screenshot of the D1 time frame, and right after that it began to depreciate.


On the W1 time frame we can see a RSI divergence and if the pair reaches its limit it should fall to 128.50 – 128.40. At that level there is a support zone marked by a light blue line on the monthly time frame.

 The next support is at 125.50 – 125.00 and it is marked with light green.


The alternative scenario is for a rally to the resistance in the zone around 139.00 – 139.50.
We should also watch the RSI divergence – in case there is a breakout above the divergence trend line we could expect a rally to the resistance zone.


Monday, January 08, 2018

EUR/JPY May Be Heading For 134.50


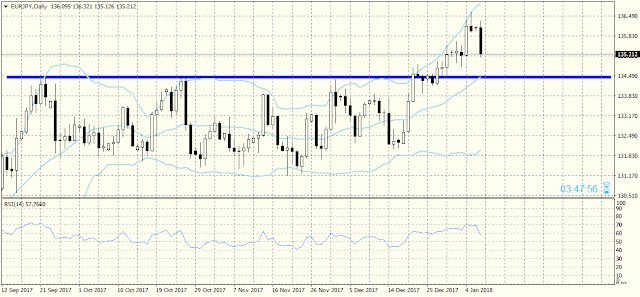
EUR/JPY could not break out above 136.50 – 136.60 and started depreciating. A signal for that were the two shooting star bars and the spinning top bar that had formed at the rally high.

What is more, the end of the European session is close and so is the closing of the D1 bar , so we should follow closely how it will close and what bar it will form. For the moment the D1 bearish bar is equal in height to the bullish bar from 4th January 2018. Should the current D1 bar close in the same manner then the depreciation will continue, I think, and the first support would be at 134.50.

If the pair breaks out below that support it is possible to keep falling to 133.50 – 133.00.


Wednesday, January 03, 2018

An EUR/JPY Drop Is Possible


 On the W1 time frame the EUR/JPY pair has formed an RSI divergence which is a signal for a possible depreciation.

On the same time frame the pair has reached a strong resistance level at 135.50 and on the D1 time frame it is also testing the same level. I think that the small spinning top bars forming below the resistance on the D1 time frame are a signal for a possible move to the downside.

 Тhe support levels on the way down are at 134.50 and at  134.00, with the second support being quite strong. If the pair breaks out below it I think it will continue depreciating to 132.50.

However, I also think that it will be difficult for the pair to overcome the support at 134.00 and that at that level it will renew its rally to the next resistance zone around 138.00 – 138.50.