Showing posts with label Trendlines. Show all posts
Saturday, October 01, 2016
Trading with Trendlines: Another Look at USD/JPY
I have written several times about the USD/JPY pair, but so far my analysis was related to the Elliott Wave Theory.
Today I am offering a different look at this pair, and this time we will draw trendlines to analyze the future scenarios.
On the weekly time frame we can see a perfect price channel in which the pair has moved to the downside from 1st November 2015 to 19th June 2016 and it has dropped with 2440 pips.
In June this year the pair visibly stopped dropping and started moving sideways, bouncing off a new support trendline.
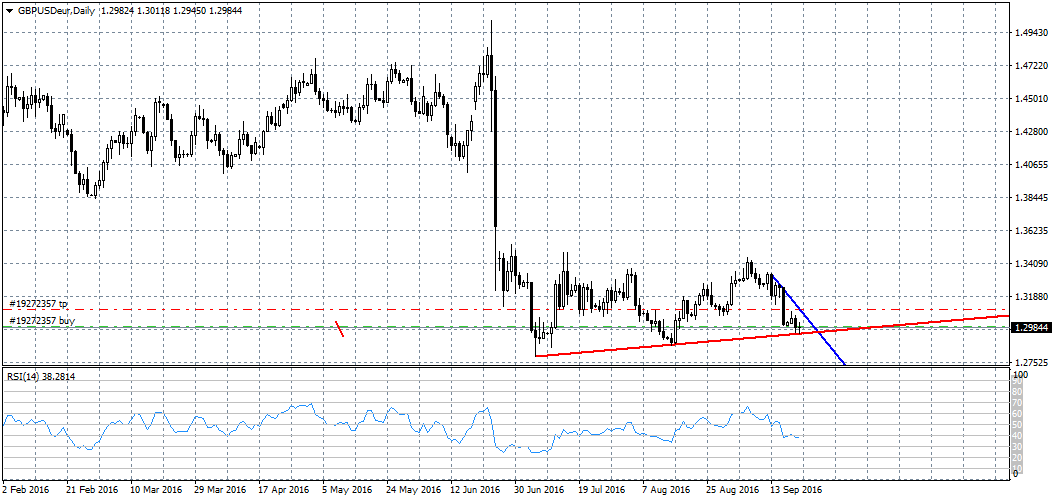
Right now the pair has reached the crossing of the two trendlines – the resistance one (in red) and the support one (in lime colour) which could be considered a signal that there will be a breakout of one of them. In case the pair breaks out above the red trendline, we could see it rising and forming a new high for the first time in the past eighteen months. A breakout below the green trendline would likely lead to a new drop.
On the daily time frame we can see that at the moment the pair is stubbornly trying to break above the resistance trendline, but there is no attempt to break below the support one.
If we examine the bars on the same time frame, we will see that there are two morning star bars, which are a clear signal for a new move to the upside. More importantly, they are formed at an important trendline. On the weekly time frame the last bar is also a morning star.
The conclusion is obvious. My personal expectation is that there will be a breakout to the upside, which could signal the beginning of a trend reversal.
Friday, September 30, 2016
Trading with Trendlines: Will GBP/USD Continue Dropping ?
No matter how perfect the trendline or the price channel there is always a breakout. And this is what we are waiting for – a breakout that we can use to trade.
This is what happened with GBP/USD, which broke below the support trendline of the price channel from 1.29258 to 1.30214 and reached its limit of 67 pips, i.e. the exact height of the channel at its base that was projected to the downside from the breakout level.
This is where we should start looking for an opportunity to draw new trendlines.
Above all else I want to point out that the 1.29500 – 1.29300 zone is a strong support zone and on the chart we can see that the pair has reached it and rebounded from it from it many times, including in the past few days.
In case there is a breakout, the support trendline of the move to the downside (the red line) will offer the next level of support, which is the zone around 1.28900 - 1.28700.
In the alternate scenario there will be a move to the upside towards the support trendline that the pair broke below, or even towards the resistance trendline (the green lines) of the trend channel.
Wednesday, September 28, 2016
Trading with Trendlines: GBP/USD Today
After the impressive bullish bar on the 4-hour time frame the GBP/USD pair formed a double bottom with the second low being only 0.9 pips higher than the first, as well as a doji bar on the same time frame, after which it started moving up again.
At the moment the pair is caught between two trendlines – the blue one of the bearish trend that began on 6th September 2016 and the red one of the move on the upside that began on 26th September 2016.
The impressive doji bar on the four-hour time frame has closed right on the resistance trendline.
Now we need to be careful and to watch the pair closely to see whether it will succeed in remaining above the resistance it broke above or will it retrace back below that level.
In case the pair does succeed in rebounding from the trendline it broke above, which in this case will have turned into a support, we will see another move to the upside towards 1.3050 - 1.3080.
In the alternate scenario, in my opinion, there will be a drop towards 1.2870 – 1.2850.
Monday, September 26, 2016
Trading with Trendlines: EUR/USD Today
After EUR/USD began rising from the support at 1.11227 when FED announced the interest rate last Wednesday this move to the upside continued in the following days and continues today.
The trendlines that I drew>>> before the news came out and before the Janet Yellen press-conference, especially the resistance trendline, still appear valid. What is more, the pair is close to reaching its target – the resistance around 1.12850 - 1.13000 and I have little doubt it will reach that level.
In my opinion, it is still too early to make a proper prognosis what will happen once the pair reaches this target, but the way it develops at that level will add some clarity to the issue and any trading decisions that follow will depend on said developments.
Saturday, September 24, 2016
Trading with Trendlines: GBP/USD in the Beginning of Next Week
My analysis about GBP/USD from 21st 09 2016>>> was correct and all that I expected happened.
The pair reached the resistance trendline at 1.31000 and rebounded to the downside, towards the support at 1.29450. It even succeeded in breaking below that level and reaching 1.29147, but it could not remain below that level for long, and climbed back up towards the breakout at the trendline, closing as a pinbar at 1.29577 on the four-hour time frame.
The pair retracing and forming that pinbar above the breakout, as well as the increasing divergence on the four-hour time frame between the chart and the RSI indicator (I am referring to the last four lows), convince me even more that in the beginning of the next week we will see a renewal of the move to the upside and we will also likely see a new test of the resistance trendline around 1.30200 – 1.30250, after which I think there will be a new drop to test the support at 1.28400.
In the alternate scenario there will be a move to the upside towards 1.32000 and higher, but at this stage this seems less likely, considering the bars on the weekly time frame, which are clear signals for a move to the downside.
Friday, September 23, 2016
Trading with Trendlines : USD/JPY Today
Today I am
following the USD/JPY pair.
On the
thirty-minute time frame we can see that the pair is forming a flag.
To
reiterate what the flag characteristics are:
-There is a
strong resistance or support that is causing the consolidation.
-The figure
is corrective, forming in a direction opposite of the main trend.
-After
there is a breakout the trend continues, and so this is considered a
trend-continuation figure.
-You need
four points to draw it.
-The
support and resistance trendlines are parallel or slightly converging.
-The flag
is relatively smaller than the trend it is correcting.
The limit
of the flag is its height at its base, in this case between low 1 (in red) and
high 1 (in blue) in pip value. We have to project that height from the breakout
level in the same direction as the trend.
It is
imperative, however, to wait for a breakout and common sense dictates to place
pending orders a few pips below the breakout level.
In this
case the possible limit is 67 pips.
Wednesday, September 21, 2016
About Trendlines and Their Importance in Technical Analysis (Part 3)
Later today we can expect the announcement of the FED interest rate, as well as a speech from FED Chair Janet Yellen.
Although such news usually cause tension and the market volatility drops until it comes out, I want to share what I expect and what my positions are beforehand. I made my decisions based on important trendlines and the pin bars that formed on the four-hour time frames.
EUR/USD: I expect that the most traded currency pair will move in favour of the EUR. The pair is at a support level at 1.1123 and on the four-hour time frame there is a bullish pin bar. I expect a move to the upside, towards the resistance trendline that has been framing the figure that the pair has been forming since 8th August this year.
GBP/USD is also at an important support level (the red line). What is more, in the past 24 hours the pair formed a double bottom on the four-hour time frame, not to mention that the two bars there are bullish pin bars. I expect a move to the upside towards the resistance trendline (the blue line) around 1.2090 – 1.3100. Once the pair reaches that level I think there will be a renewal of the move to the downside.
Monday, September 19, 2016
About Trendlines and Their Importance in Technical Analysis (Part 2)
Today the GBP/USD pair was retracing after the 250 pips drop last Friday, but despite that there was an opportunity to profit. One look at the charts was enough to notice the price channel in which the pair had been moving since the market opened during the night. The pair rose with 95 pips between the parallel lines of the price channel.
Since I know that after such a 250 pips drop a correction is all but mandatory, I used the smallest possible time frame (in this case the fifteen-minute one) and I opened a long position after noticing a divergence between the chart and the RSI indicator, placing a stop loss a few pips below the support at 1.2996.
After GBP/USD formed a pair of higher lows (the red 1 and 2) I drew the first trendline (the darker blue one). After that I drew the parallel trendline through the first high (the lighter blue line). That way the price channel was visible and I could trade from a high to another high, watching the price closely and closing my position – and profiting – every time the pair reached the resistance trendline.
The Bollinger Bands indicator also helped when the pair reached high 5 (in blue) at the upper band of the indicator on the one-hour time frame, which was a signal that the move to the upside had most likely ended for the moment. I was right about that and the pair started dropping, which gave me an opportunity to open a profitable short position. Meanwhile the pair not only reached the support trendline (the dark blue one) but it also broke below it.
This correction probably isn’t over, but I have closed my position and I am waiting for further development before I make any new decisions.
Saturday, September 17, 2016
About Trendlines and Their Importance in Technical Analysis
Many newbie traders and some more experienced ones don’t realize how important trendlines are in technical analysis and how one can use them to improve their trading skills.
I know from personal experience that the moment I learned to draw the correct trendlines the chart essentially started “talking” to me in a clear language.
Unfortunately, many technical analysts often somewhat ignore trendlines and count more on indicators, candlesticks, waves and other approaches that can complicate a trader’s understanding of the logic of the forex market.
In the next few posts I will try to show how trading can be made easier by knowing how to draw the correct trendlines on every given chart and how much can all traders learn from them regardless of their level of experience.
Subscribe to:
Posts (Atom)