Showing posts with label LCrude. Show all posts

Thursday, August 18, 2016

LCrude Will Continue Climbing towards 51.00 at the Very Least


The pinbar that formed on the weekly LCrude time frame had the result that I expected and LCrude has been been moving inexorably to the upside for three weeks now, having formed one small correction. I think it’s quite possible for that rally to continue towards the zone around 51.00 – 52.00, where there is a resistance visible on weekly time frame.


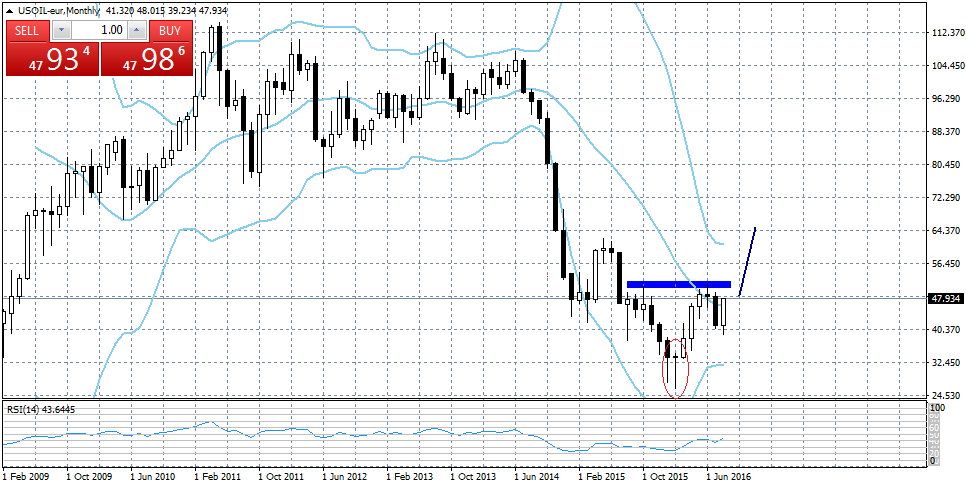
The more optimistic scenario is for a move to the upside towards 65.00 – 66.00, an idea supported by the pinbar formed on the monthly time frame at 34.00, as well as what we know about corrective waves – they tend to form in pairs, with correction between them.

If we examine the monthly time frame we will see a fully formed corrective wave from 26.045 to 51.654, then a retracement after which the move to the upside continued. If we assume that the second corrective wave will be as long as the first one, then that optimistic scenario for a rally towards 65.00 could turn out to be valid.


Thursday, August 11, 2016

LCrude Will Continue Climbing


The LCrude charts this week could have been used for a trading textbook illustration.

The pinbar on the weekly time frame was a clear signal for a move to the upside and after a short retracement in the past two days it sharply moved north, which was completely expected.
It is important to see how the weekly bar will close tomorrow, but my expectation is that it will do so around $44.65 – $44.80.


If we examine the large time frames, i.e. the weekly and the monthly ones, it becomes clear that the most probable scenario is a further move to the upside towards $65. That move will need time to develop, but it is very likely to happen.


Monday, August 08, 2016

The LCrude “Free Fall” Appears to Have Ended


Or at least this is what the pin bar that formed on the weekly time frame is a signal for. Everyone using a price action strategy consider that one of the most telling reversal signals one can see. And since in this case it formed on the weekly time frame, said signal should have long-term effects.


Experienced traders would usually wait for a slight retracement after such a signal (usually to the middle of the pin bar). Being aware of this I looked for this possibility on a much smaller time frame, i.e. the daily one. On that time frame you can see that LCrude has reached the resistance at 42.80 – 43.00 and it is possible it will begin retracing. I sincerely hope that will happen, because at the end of it there will be an excellent opportunity to open a long-term long position.


Wednesday, August 03, 2016

Will LCrude Continue Dropping


The LCrude surprisingly climbed today, after the Crude Oil inventories that came out turned out to be more positive than expected.

At this stage, however, that hasn’t affected the Canadian dollar, which moves in correlation with LCrude. USD/CAD dropped during the European and American sessions with almost 100 pips, but that happened before the Crude Oil inventories data and the rest of the fundamentals today came out.

What is interesting in this case is whether this is the end of the LCrude move to the downside that has been continuing for two months now, or will we see another drop towards 38.00 – 38.50.

Whether that will happen is hard to predict, but one thing is clear – the LCrude drop is nearing its end and it’s time to see a seasonal move to the upside.


Wednesday, July 27, 2016

Regarding LCrude, the Federal Funds Rate and CAD


Earlier today the positive data about the Crude Oil inventories caused a sharp drop in the LCrude charts. That in turn affected the “oil” currency pair USD/CAD, which, after a purely technical drop of 90 pips in the past few days, jumped sharply to the upside and climbed with 70 pips for less than 30 minutes.

Later today we expect the announcement of the Federal Funds rate and analysts believe that rate will remain unchanged. 


From a technical analysis point of view the situation on the smaller time frames is unclear – it’s difficult to say whether the pair will start dropping right away today or will it reach its natural resistance level at 1.3300 first, which can be seen on the weekly time frame. 

I, personally, expect that the pair will reach the resistance level towards which it has climbed in the past 11 days first. I can’t say, however, when that will happen. The last bullish candlestick on the four-hour time frame, which was affected by fundamentals, engulfed the five previous candlesticks, and it is normal to see retracement to the downside afterwards. 


Considering that the resistance at 1.3250 is quite strong as well a further move to the upside seems even less likely.


 On the other hand LCrude appears to be in a freefall state.

In other words, today the fundamental news make the technical analysis picture quite unclear. All trading should be done very carefully.