Showing posts with label Bollinger Bands. Show all posts

Thursday, July 21, 2016

The Secrets of Bollinger Bands, Part 4 – Continuation. How to Use the Indicator


The general rule is that when the price moves outside the Bollinger Bands the trend tends to continue. We can use this characteristic of the indicator to make a judgement about the market direction – when the price is touching and breaking above the upper band, the trend is bullish. When the price is touching and breaking below the lower band – the trend is bearish.

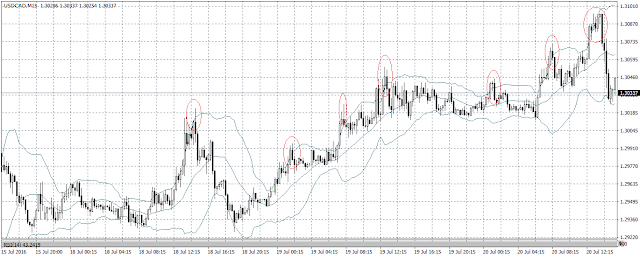
Sometimes, however, the price breaking out outside the bands means that there is a false breakout – i.e. the price has tested a level and then it has retraced from that level. In those cases one has the opportunity to open positions against the trend, but one should always be careful to make sure it really is a false breakout. One should also always keep in mind that trading against the trend is a trading approach that should be attempted by experienced traders. If you don’t feel that you have enough experience to do that, don’t try it.


On picture 2 you can see a few of these trading opportunities.
They are usually characterized by a sharp breakout outside the Bollinger Bands and they tend to be very visible.


Wednesday, July 20, 2016

The Secrets of the Bollinger Bands Indicator, Part 4. How to Use the Indicator


The indicator’s developer himself lists the following characteristics of Bollinger Bands:

- Sharp price movements (in either direction) usually occur after the distance between the Bollinger Bands has decreased.

- If the price moves outside the Bollinger Bands we should expect a continuation of the current trend.

- If the price forms a high or a low outside the Bollinger Bands and then forms a high or a low inside the Bollinger Bands it’s possible to see a trend reversal.

- Usually a movement that begins at one of the outer bands tends to reach the other outer band. This observation can be useful when planning new positions.

To be continued…

Wednesday, July 06, 2016

The Secrets of Bollinger Bands Part 3 - Indicator Description


The Bollinger Bands determine the natural highs and lows in a developing trend. If the bands are pointing north, then the price usually climbs, until there’s a good enough reason to stop.

The zone of stagnation develops either above the upper band or below the lower band.

This stagnation does not end until the Bollinger Bands begin to spread, moving away from the price bars, which is a signal that the resistance (or the support) has been overcome.

The price could move sharply in the direction of the current trend, sticking closely to the Bollinger band. Of course, one should always keep in mind that price movement depends on all levels of support and resistance, not just those that are associated with Bollinger Bands.

One should not look for ideal conditions to open new positions. We have to be aware that the conditions will never be perfect, and we need to learn to trade in imperfect conditions, even when we see false signals.


Saturday, July 02, 2016

The Secrets of Bollinger Bands Part 2 – Indicator Description


Visually speaking the indicator consists of two lines that frame the price from above and below. They can be viewed as dynamic lines of resistance and support and most of the time they are plotted away from from the price.

The width of the Bollinger Bands itself depends on the volatility – when the market is more volatile, that width increases automatically, when it’s less volatile it decreases – also automatically. The main rule is that 95% of the price movement is always contained within the Bollinger Bands and about 5% remains outside of them.

The Bollinger Bands indicator consists of three lines:

-The middle line is a simple moving average.
-The upper band is the same moving average that is plotted a number of standard deviations away, usually 2.
-The lower band is the same moving average, plotted a number of standard deviations away, usually 2, but below the middle line.

If the indicator’s properties are set properly, then the middle line can be considered as a great level of support and resistance, and the bands can serve as targets of opened positions.


 To be continued...


Friday, July 01, 2016

The Secrets of the Bollinger Bands Indicator Part 1


The first time this indicator was described was in 1987 by Perry Kaufman in his book called The New Commodity Trading Systems and Methods. Later the indicator became widely popular thanks to the American analyst John Bollinger.

He was born in California and first worked as a cameraman, but quickly forgot his first profession and devoted himself to his work as a technical analyst of the Financial News TV channel. During the course of his work he had the opportunity to observe and study the financial markets. It was exactly during that period – between 1984 and 1991 - that he created his own system for rational analysis, which is being used to this day and is still as relevant as it was decades ago, now popularly known as “Bollinger Bands”.

In a series of posts I will do my best to introduce you to the nature of this useful and simple indicator, which gives us important information about the way an instrument moves, and also I will elaborate on the ways that it can be used rationally and effectively while we trade.