Showing posts with label USD/JPY. Show all posts

Wednesday, August 15, 2018

A USD/JPY Assessment


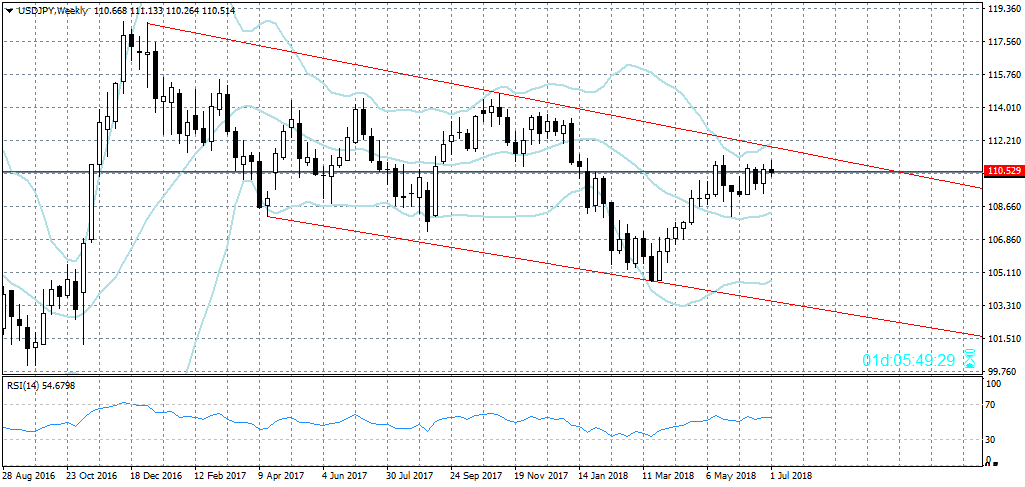
The pair reached the diagonal resistance trend line of the wide trend channel in which it has been developing since December 2016, but it made no attempt to break out and renewed its depreciation.


The depreciation could be just a test of the support at 110.50 in order for the pair to gather liquidity before it attempts to break out above 111.20. The alternative scenario is for a continuation of the depreciation toward 110.20 – 110.00.

The most extreme scenario is for the breakout above the red trend line to have been false and for the USD to continue falling, moving within the red trend channel.

We could think about a long term rally only after a breakout above the red trend line, a breakout above 111.20 and if the pair remains above that level.


Friday, August 10, 2018

The USD/JPY Depreciation Continues Toward The Support Zone At 110.20 – 110.00

The pair continues moving slowly and correctively within an unbroken trend channel toward its first target to the downside, which is the support zone at 110.20 – 110.00.


I think that despite the slow and very hesitant move south the depreciation may reach 109.60 – 109.40. That is the zone within which the USD could find strong support and from there it could renew its upward trend.


The alternative scenario in case there is a breakout below that support is for the pair to continue depreciation. For the moment that scenario appears less probable, not to mention that the USD remains exceptionally strong against all other currencies – so much so that its weakness against the JPY causes confusion.

For the moment we can expect the depreciation of the USD to the first support at 110.20 – 110.00.


Wednesday, August 01, 2018

The Market Expects The Announcement Of The FED Interest Rate


That announcement will come out later today and the markets are, as expects, consolidating while waiting for it.

Preliminary data suggests no change in the interest rate, although surprises are always possible.

Yesterday the USD/JPY pair rallied with over 150 pips (from  110.74 to 112.14), after which a new butterfly pattern was formed on the H4 time frame, which hinted that the drop is impending, but the USD won’t begin depreciating before the news come out.

I think the pair will fall at least toward the main trend line of the upward trend (in dark blue).
In case of a breakout the drop could last to around  110.00 – 109.50.

The alternative scenario – in case the trend line holds, is for a renewal of the upward movement of the USD.


Friday, July 20, 2018

The Expected USD/JPY Depreciation To Test The Trend Line Is A Fact


After briefly reaching 113.171 the pair began the expected depreciation to test the trend line it broke out above.
It reached the support level to the downside at 111.40 very quickly. I think the pair may continue the depreciation toward 111.00 but in my opinion there will be a renewal of the upward movement soon so it could test the next resistance in the zone around 113.50 – 114.50, followed by 115.00. After that we may witness a deeper correction to the downside.
In the alternative scenario the pair may continue the correction to the downside with a depreciation to 110.00 – 109.60 before it gathers liquidity to rally toward 114.50.
 

Thursday, July 12, 2018

The Path To 118+ Before USD/JPY Is Open

USD/JPY finally broke out above the resistance trend line of the channel from 118.660   (11th June 2016) to 104.629 (18th March 2018) and at the moment is trading around 112.50-112.40.

In my opinion this breakout would open the way for a rally to 115+ and in the long term – 118+.

The closest resistance for the pair, however, is in the zone around 113.50 – 114.50. I think that the rally of the USD could reach that zone, but to overcome it the pair should form a correction that would test the trend line it broke out above.

In the alternative scenario the pair would begin a correction to test the breakout right now.


Friday, July 06, 2018

The USD/JPY Depreciation May Continue Next Week

After multiple attempts to break out above 110.70 – 110.80 and after the poor NFP data today, USD/JPY renewed its depreciation, reaching 110.376.


110.30, however, is a strong support for the USD on the D1 time frame and the pair has been testing it for three days now without being able to break out below it. I doubt there will be a breakout until the end of the trading week today. I do expect, however, that next week those attempts will continue and in case there is a breakout and the price remains below 110.20  there could be another drop to 109.90 -109.80.


The alternative scenario is in case the pair fails to break out below the support – it could renew its upward movement and test the resistance at the trend line of the channel (marked in red).


Friday, June 22, 2018

The Most Probable USD/JPY Scenario Is A Depreciation


USD/JPY continues developing within a relatively wide range for a fourth day now, locked between 109.50 and 110.70 and neither can it break out below the support in the zone around 109.50 and 109.80 nor can it rally and reach its target at the resistance trend line (in red) of the channel.

On the H4 time frame there is a Gartley Butterfly pattern (in red) as well as a pennant (in blue) and the pair has broken out below it.


The closest target to the downside is at 133.40 and if the pair reaches the limit of the Butterfly then the depreciation should last to 108.10 – 108.00. That is a strong support zone on the W1 time frame, so how it will develop further depends on the way the pair behaves when it reaches it.

The alternate scenario is for a direct rally to 111.50 – 111.60 (on the W1 time frame), but that scenario appears less probable for the moment.

Tuesday, June 12, 2018

USD/JPY Is Moving Toward The Resistance Trend Line

 The pair looks like the USD is preparing to test the resistance trend line of the channel which has started developing in January 2016 from 114.386. I think it will test it around 111.40 – 111.50.

The interesting part will start once the pair reaches the trend line. If it overcomes the resistance and remains above the trend line we could expect a solid rally of the USD.


In the alternate scenario there could be a depreciation toward the support trend line.
Tomorrow FED is expected to hike the interest rate which could give the US currency a serious push north.

Whatever the market chooses, I think the news coming out of the USA will be the catalyst of that movement and until then we could expect the pair to remain undecided.

Saturday, May 19, 2018

USD/JPY Is Headed For The Resistance Trend Line Of The Channel


The expected rally of the USD/JPY pair became a reality, and said rally turned out considerably stronger than what was expected initially.

If we examine the W1 time frame we cannot fail to notice that what the pair is forming strongly resembles a flag and the pair has reached its trend lines four times – twice the resistance and twice the support trend line. The figure, however, is rather deep so I’d rather not actually call it a flag.

It appears that the pair is headed for the resistance trend line for a third time. It is possible to form a correction to 108.00 before it tests the resistance.

In the alternative scenario the pair will continue directly to the resistance trend line.

The more interesting question is, I think, whether the pair will break out above the resistance trend line. If that happens, we could expect a serious continuation of the upward movement. The height of the channel at its base is 1000 pips, but whether the pair could reach that limit is another matter, which is up for the market to decide.

Saturday, April 28, 2018

I Expect A Bearish USD/JPY Correction Before A Test Of The Resistance at 110.00 – 110.50


I expect a renewal of the downward movement for the USD/JPY pair too. 

The D1 bar for last Friday closed as a hanging man at the high of the upward movement under the W1 resistance at 109.017.

I expect that next week the depreciation will continue to the zone around 108.30 – 107.80 where the pair will meet a strong support on the W1 time frame.

On the monthly time, however, the upward trend is still valid. Until the end of the month there is only one more daily trading session left, the monthly bar will close on Monday, but the strong resistance is all way at 110.00 – 110.50.

That is why I expect the depreciation at the beginning of next week to be corrective in nature, in preparation for the test of the monthly resistance.


Thursday, April 26, 2018

The Bullish USD/JPY Trend Will Remain In The Medium Term


 As I expected, USD/JPY continued moving to the upside>>>  and for the last week the pair has rallied with 180 pips (from 107.656 to 109.469).
I expect that next week the move north will last until 110.50, after which there could be a corrective depreciation of about 150 pips, which means it could reach 109.00 - 108.80.

The main trend, however, will remain bullish, and the pair, I think, will reach the resistance trend line around 111.60 – 112.00.

For the moment the pair is developing within a trend channel that is over 1000 pips wide, but it is possible for it to form a different pattern in the long term.