Showing posts with label USD/CAD. Show all posts

Friday, June 29, 2018

USD/CAD Finally Began The Expected Depreciation

The pair has reached the first target to the downside at 1.3150, but in my opinion the depreciation is not over.

In case the pair breaks out below the support I think it will head for the next support level which is the diagonal trend line marked with a thin red line (that is the 1.2980 – 1.2950 zone).


On the D1 time frame one can also notice a Gartley butterfly pattern, the limit of which is point A. With the caveat that not nearly all limits of Gartley butterfly patterns are reachable, it would be interesting to see whether the pair will reach this one. If that happens we should expect a depreciation to 1.25621.

In the alternative scenario after a drop to 1.2850 the pair would renew the move north.


Tuesday, June 19, 2018

The Powerful USD/CAD Rally Continues


 Contrary to my expectations for a depreciation, after the breakout above the resistance around 1.2990 – 1.30 the USD/CAD pair continued rallying and is now at 1.3280.


The noticeable thing is that despite the large rally the trend does not show any signs of exhaustion. In my opinion, there are no trustworthy signals even for an impending corrective depreciation – neither the bars hint at that, nor does the RSI indicator. The RSI divergence is only on the H1 time frame, but in my opinion it has not been confirmed for the moment and it is not particularly trustworthy, so it is not very likely to come to fruition.

Under these circumstances it’s prudent to keep long positions with the appropriate Stop Loss that protects one’s profits and account.

I think that even if there is a correction in the future it won’t be very deep and the visible target of the rally is around 1.3690 – 1.3700.

Thursday, May 10, 2018

The USD/CAD Depreciation Began

The longer the time frame is, the larger the movement after a signal is, but also the longer one has to wait for that movement to begin.

This is exactly what happened on the USD/CAD charts, after at the end of last month the pair formed a signal consisting of two monthly bars: a shooting star and a hanging man, which warned for an impending depreciation>>> .

Before said depreciation began the pair once more tested the resistance at 1.30 and at 1.29972.
The first strong support on the way down is at 1.2650, but in my opinion the bearish trend will continue until the pair reaches the potential trend line of the channel (in blue) that is forming on the chart. And that means another 300 – 320 pips drop.

Once we see the way the pair develops when it reaches the support trend line we may be able to analyze its further movement.


Wednesday, May 02, 2018

A Falling Star And A Hanging Man – This Powerful Bar Combination Is A Signal For A USD/CAD Trend Reversal From A Bullish Into Bearish One


That exact bar combination appeared on the monthly time frame of the USD/CAD pair and it has formed right below the strong resistance at 1.2990 – 1.3000 (marked by the middle line of the Bollinger Bands indicator).

We can expect quite confidently that a bearish trend is about to begin and it is possible for it to last several months (every signal is supposed to be traded on the time frame it appeared, and the longer term that time frame is, the longer term that movement will be).

On the W1 time frame the pair is developing in a consolidation channel with about 800 pips width and it appears that it is time for the subwave C from the correction to the downside (in green) to begin.

On the D1 time frame there is a barbed wire pattern of seven bars that have already closed below the resistance at 1.2290, which confirms that expectation.

I think the first long term target is around 1.2650 and after the pair overcomes that support we can expect another depreciation to the lower band of the Bollinger Bands indicator on the monthly time frame.


Friday, April 13, 2018

After A Short Correction The USD/CAD Pair May Continue Falling


After four weeks of depreciation that led the pair from 1.31243 (19th March 2018) to 1.25437 (11th April 2018) it found support to begin a correction.

The double bottom that formed on the H4 time hinted at the beginning of the correction, and my expectation is that the pair will rally correctively up to around 1.2690 – 1.2700.

The movement, however, continues developing within the trend channel (in blue) and after the end of the correction the depreciation to the support around 1.2350 -1.2370 may resume. That can be observed best on the W1 time frame.

What remains is to see what the market will choose – whether there will be a breakout below the support trend line of the channel (in blue) or there will be a continuation of the consolidation within the channel’s boundaries.


Saturday, March 31, 2018

The USD/CAD Prognosis For The Next Week


We can’t ignore the interesting development of the USD/CAD pair with the caveat that on Monday (3rd April), which is a holiday, we can hardly expect big movements on the market.

The pair began moving north and for the moment it is developing within a perfect trend channel with a height at its base exactly 855 pips.

If we suppose that the market will follow the trend lines then we should expect a test of the resistance trend line (in blue), a renewal of the depreciation to the support trend line of the channel (in red) and a possible breakout in order for the depreciation to continue toward the next support trend line (in blue).


The alternative scenario is a breakout above the resistance trend line (in blue) and a rally to 1.3750 – 1.3800.


Tuesday, March 06, 2018

USD/CAD Is At A Strong Resistance


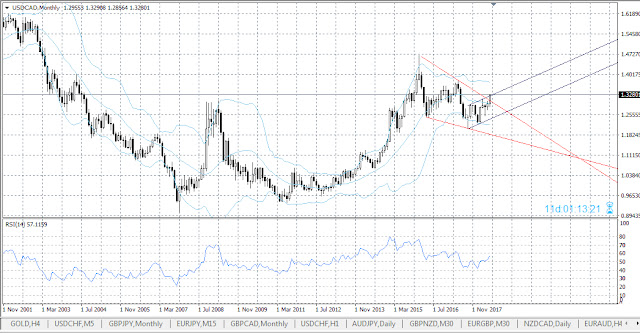
USD/CAD reached a strong monthly and W1 resistance marked by the middle line of the Bollinger Bands indicator at 1.30004 and, as it could’ve been expected, stopped for a correction to the downside.

There are no more than 20-25 pips left until the resistance trend line of the supposed wedge (marked in red on the monthly and W1 time frames) and the pair may reach it in the next few days as it develops a sideways consolidation.

From then on there are two logical scenarios:
The first scenario is for a breakout above the trend line and a rally to 1.3770-1.3800. The second one is for a renewal of the drop to the support trend line.

The market will decide which scenario the pair will pick.