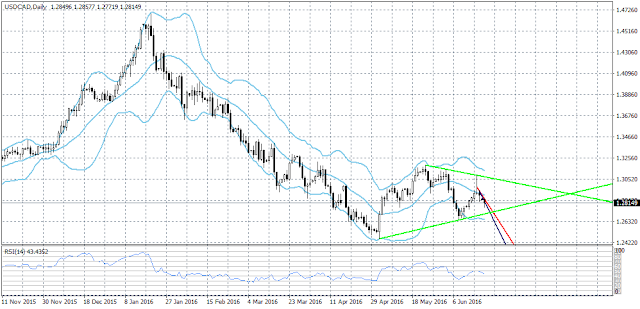
As I examine the trendlines as well as the support indicated by Bollinger Bands on the four-hour time frame, I think that the pair retracing to the upside is perfectly logical.
You can see several trendlines on the screenshot, and the two inner ones make me think that there’s a large possibility that we will see a figure that graphical analysis calls bump and run reversal forming soon.
The retracement to the steeper trendline (the blue one) also makes me think that the pair will very likely continue falling.
USD/CAD still hasn’t reached the main trendline (the green one) that connects the lows on the 3rd May and 8th June and so far there is no indication that the pair won’t reach it.
Taking all this into consideration, I think that the logical approach to trading this pair is to sell at every retracement to the upside.


Good insight.
ReplyDeleteVery nice tip I'll keep it in mind.
ReplyDeleteI'll be watchful on these levels, thank you for sharing!
ReplyDeleteGreat analysis as always.
ReplyDeleteGood point! I´ll be watching to those levels.
ReplyDeleteGood post!
ReplyDeleteGood posts, very helpful for all traders.
ReplyDeleteUseful analysis!
ReplyDeleteVery good analysis.
ReplyDelete