Saturday, July 30, 2016

USD/CAD Reached the Top of the Trend Channel and Started Falling


It’s logical for the pair to continue moving to the downside towards the support trend line at the 1.2850 level.
That by no means should make us think, however, that the range will end with this drop.

In my opinion there will be another move to the upside once the pair reaches the above mentioned 1.2850 level and USD/CAD will reach 1.3300, or a level even higher than that, around 1.3400 – 1.3500.


If this range that has continued for months is actually forming a flag we can conclude that once it ends there will be a new drop towards 1.1800 – 1.1900.

For the time being, however, the prognosis is for a move to the downside, because the rest of the movements will form on the weekly and the monthly time frames, which means they will take place over a long period of time.


Thursday, July 28, 2016

The GBP/USD Range Continues


In the past few weeks the British Pound has been a currency that is not easy to analyze from a technical analysis point of view, since it depends on the fundamentals, i.e. on politics, so much.

It has been a little over a month since 23rd June, but GBP is still at the same historically low levels after it fell to 1.3226 in that night and a few days later it reached 1.2788.

Ever since then GBP/USD has been trying to form a correction, but the pair couldn’t reach higher than 1.3480 – and that level was achieved only briefly.


In the past two weeks GBP/USD has been moving in a relatively tight range between 1.3290 and 1.3060. The reason is obvious for everyone – no one dares to risk buying this pair, which depends so much on politics at this stage. The braver traders have only one way out and it’s trading the range. From a purely technical view, the expectation is that the pair will continue moving for about 230 pips in either direction in case the range is broken. And no one can really make an accurate prognosis in what direction that breakout will happen.


Wednesday, July 27, 2016

Regarding LCrude, the Federal Funds Rate and CAD


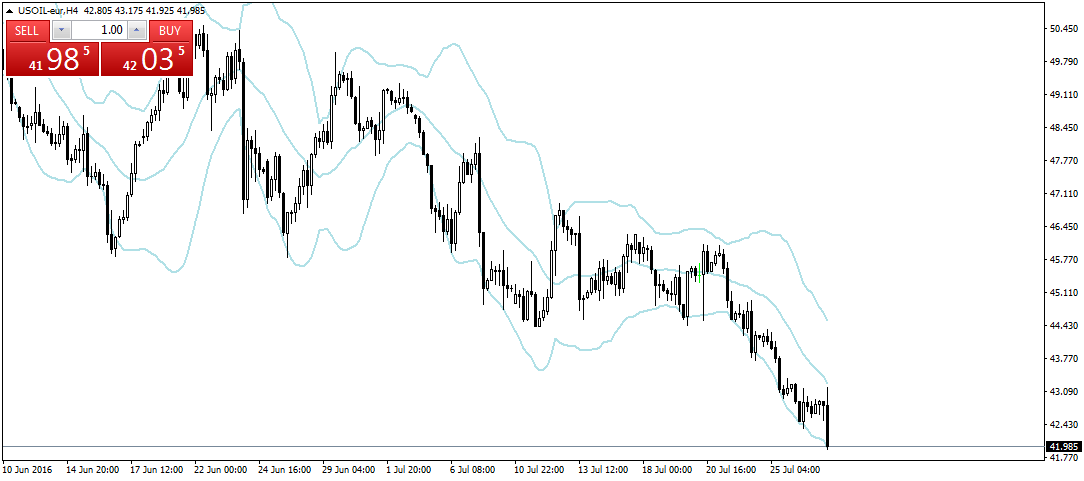
Earlier today the positive data about the Crude Oil inventories caused a sharp drop in the LCrude charts. That in turn affected the “oil” currency pair USD/CAD, which, after a purely technical drop of 90 pips in the past few days, jumped sharply to the upside and climbed with 70 pips for less than 30 minutes.

Later today we expect the announcement of the Federal Funds rate and analysts believe that rate will remain unchanged. 


From a technical analysis point of view the situation on the smaller time frames is unclear – it’s difficult to say whether the pair will start dropping right away today or will it reach its natural resistance level at 1.3300 first, which can be seen on the weekly time frame. 

I, personally, expect that the pair will reach the resistance level towards which it has climbed in the past 11 days first. I can’t say, however, when that will happen. The last bullish candlestick on the four-hour time frame, which was affected by fundamentals, engulfed the five previous candlesticks, and it is normal to see retracement to the downside afterwards. 


Considering that the resistance at 1.3250 is quite strong as well a further move to the upside seems even less likely.


 On the other hand LCrude appears to be in a freefall state.

In other words, today the fundamental news make the technical analysis picture quite unclear. All trading should be done very carefully.


Tuesday, July 26, 2016

USD/CAD – How Much Higher Will It Climb?


The pair has been moving to the upside for ten days now and it has risen with over 380 pips without making any significant retracement. Said move to the upside also formed a very obvious bullish trend channel.
The last highs of this powerful move to the upside even formed above the resistance trendline of that channel, but the pair quickly retraced back within its limits.

At first look the bullish trend seems exhausted, which begs the question – how much higher can this pair rise?
In my opinion, there are two most probable scenarios:

In the first one the pair will reach the previous high at 1.32413 and it will fall sharply or at the very least it will continue consolidating sideways until tomorrow, when the Federal Funds Rate will be announced.

In the second scenario the pair will continue rising to test 1.33000, which is a resistance zone formed by the Bollinger Bands indicator on the weekly time frame. This could happen today or tomorrow during and after the news.

I think, however, that regardless of which of those scenarios comes true, one thing is clear – the move to the upside cannot continue without a serious correction. We need to be very careful when trading this pair, so we wouldn’t miss the good entry point for short positions.


SmartLines & SmartOrder – An ActivTrades Webinar


The leading online broker ActivTrades offers its clients a number of highly useful and practical trading tools. Among them are SmartLines>>> and SmartOrder>>>.

The former is a is a state-of-the-art, yet easy-to-use, application for MetaTrader 4/5 enabling automated execution in the chart based on pre-defined Trendlines and the latter is designed to increase your trading speed and improve the process of managing your positions by enhancing the functions of the MT4 and MT5 platforms.

On 28th July, between 7pm and 8pm, ActivTrades will hold an online webinar, led by professional trader Paul Wallace, who will tell you more about the functions of these amazing and practical trading tools.
Like all ActivTrades webinars, this one will be free and open to the public.

Learn more about it and register for the webinar by following this link.>>>

Saturday, July 23, 2016

Gold Is Close to Renewing the Move to the Upside


Gold could not break below 1375 and started falling. If you look at the chart you can clearly see that the waves to the upside are corrective, formed in threes and are relatively equal in length, which is normal. If we add the trendline that connects the two higher lows we can see that the price of Gold is very close to reaching said trendline for a third time.


I examined the chart and I think that the most probable scenario is for Gold to reach this diagonal trendline which will likely happen very soon and then to renew its movement to the upside, since the limit of the downwards trend channel that formed between 7th July 2013 and 13th December 2015 and which was broken to the upside on 7th February 2016 at the 1215 level has not been reached yet.

We know that in order set the limit of such a technical analysis figure we need to project the height of the downwards channel from the breakout level to the upside and in this case the limit is set around 1423 – 1424. In this case the hypothetical third wave to the upside would be almost as long as the previous two and it would reach the limit of said channel.

In the alternate scenario Gold will break below the trendline and it will continue falling towards 1275 or even towards 1230, but at this stage this scenario does not seem to me to be very probable.


Thursday, July 21, 2016

The Secrets of Bollinger Bands, Part 4 – Continuation. How to Use the Indicator


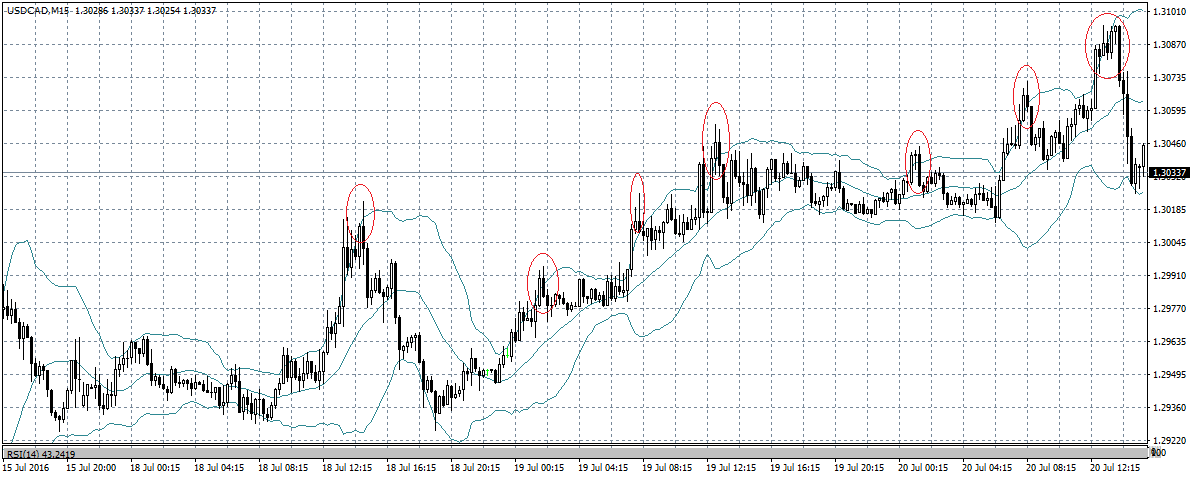
The general rule is that when the price moves outside the Bollinger Bands the trend tends to continue. We can use this characteristic of the indicator to make a judgement about the market direction – when the price is touching and breaking above the upper band, the trend is bullish. When the price is touching and breaking below the lower band – the trend is bearish.

Sometimes, however, the price breaking out outside the bands means that there is a false breakout – i.e. the price has tested a level and then it has retraced from that level. In those cases one has the opportunity to open positions against the trend, but one should always be careful to make sure it really is a false breakout. One should also always keep in mind that trading against the trend is a trading approach that should be attempted by experienced traders. If you don’t feel that you have enough experience to do that, don’t try it.


On picture 2 you can see a few of these trading opportunities.
They are usually characterized by a sharp breakout outside the Bollinger Bands and they tend to be very visible.