Tuesday, February 28, 2017
USD/JPY Continues Moving Within A Wide Consolidation
The attempts to move to the upside at the moment are completely in vain and after every small rally there’s a new drop.
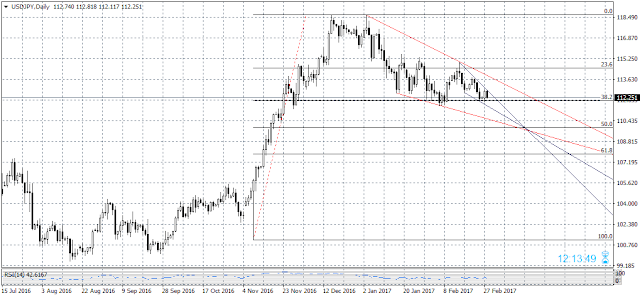
The moves to the downside aren’t particularly convincing either and for a month and a half now the pair has been moving within a wide consolidation between 115.60 and 111.60.
The patterns formed by the trend lines (on the H4 and daily time frame) around the moves to the downside suggest the formation of a wedge (in red) and another, smaller wedge on the smaller time frames (in blue). The critical zone is around 110.80 – 110.40, which is 50% Fibo of the impulse move to the upside from 9th November 2016 to 15th December 2017 (101.190 – 118.660).
It is obvious that the move to the downside is corrective and in my opinion we should be very careful when it reaches the above-mentioned zone around 110.80 – 110.40.
I think it is too early to expect a breakout and to look for a possible limit of those patterns, but we should follow their development closely in order to react on time.
Subscribe to:
Post Comments (Atom)


Thank you for the detailed analysis.
ReplyDeleteImportant levels to watch out!
ReplyDeleteGood analysis. Very good explanations.
ReplyDeleteIt could be a good turning point.
ReplyDeleteGood insight.
ReplyDeleteGood post!
ReplyDeleteThanks for such an informative analysis.
ReplyDeleteThanks for the analysis.
ReplyDelete