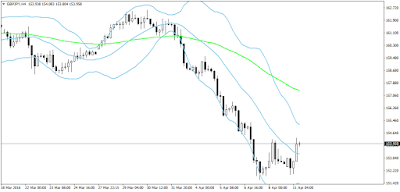
The pair has been falling and falling hard for the past nine months.
Despite this you can see a signal on the daily time frame that a correction is about to begin.
After those two candlesticks there was another attempt to test the support at 152.00, which is also something that happens often at the beginning of a correction. If the pair does start rising the first level of resistance is, in my opinion, around 155.00 – 155.20, which is the upper band of the Bollinger Bands indicator that can be viewed on the 4-hour time frame.
In conclusion I would say that we should follow very closely how the pair behaves at that level.


Thank you for the helpful analysis!
ReplyDeleteGood post.
ReplyDeleteThanks for such an informative analysis.
ReplyDeleteAs always, very detailed analysis.
ReplyDeleteOr a reversal due to the potential double bottom pattern.
ReplyDeleteCorrection movement continues.
ReplyDeleteUseful analysis.
ReplyDeleteGood post!
ReplyDelete