Tuesday, October 31, 2017

ActivTrades: Balance Protection


 The leading online broker ActivTrades places the interests of their clients above all else and as such the broker will not allow your balance to go into negative.

The trade out level on the client’s accounts exists to make sure that they will not lose more money than the deposit they have made. ActivTrades also offers Balance Protection Policy as an additional safeguard and will credit your account to a zero balance in case your account goes into negative as a result of trading.

This Balance Protection Policy also applies to more than one accounts so if a client has a negative balance in one account and a credit balance in a second account then the credit balance will be used to offset the negative balance. This Policy can also be used with joint accounts, where each joint account holder will be responsible for a debit or credit available equally.

The ActivTrades balance protection is available to all retail clients.

You can learn more details about the ActivTrades negative balance protection here.>>>


Monday, October 30, 2017

USD/JPY Could Not Break Out Above 114.50 And Returned Within The Consolidation

Despite my high hopes to see a rally of USD/JPY, the charts are giving a totally different signal – one for a drop.

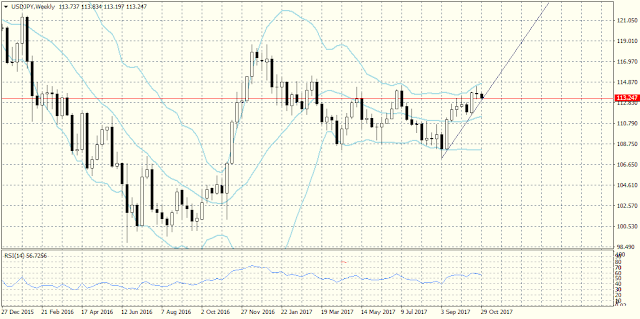
The pair could not break out above 114.50 and at 114.345 the bulls gave up. The weekly bar closed as a doji under the resistance marked by the Bollinger Bands indicator and the last of the series of daily bars at the high closed as a bearish hammer.


At the moment the pair is around 113.24 and at that level is the diagonal support trend line on the W1 time frame. The zone around 113.24 – 112.80 will be crucial regarding the future development of the pair.

If USD/JPY succeeds in overcoming that zone we could see it resume the medium term bearish trend with targets at 111.00 and 107.00.

The targets to the upside have long been known, but let’s see what the market will pick now.

Saturday, October 28, 2017

There Could Be A Drop And A Test Of the NZD/USD Local Low


It appears the NZD/USD is about to form a flag or a pennant on the monthly time frame.
 
This is the largest possible time frame and the potential development of such a figure will take months, but its possible target is worth the wait.


 On the W1 time frame there is another fully developed flag and the pair with a breakout below the support trend line. If the pair reaches the limit of that flag we could see a drop to around 0.6250-0.6220 which means a test of the local low from August – September 2015.

The other possible target is 1500 pips away from the breakout level.

The third long term scenario is another rally after the possible drop and test of the local low, which would lead to the development of the above mentioned flag or pennant figure.

Friday, October 27, 2017

EUR/USD Is Heading For the 38.2% Fibo Zone


After the two spinning top bars at the high of the upward movement on the monthly time frame and the resistance around 1.19 EUR/USD completely logically started falling. Its first stop on the way down was the 23.8% Fibo around 1.1700 – 1.1720.

I expected a little deeper correction to the upside, but the pair could not rally considerably and headed for the next Fibonacci level at 38.2% of the impulse wave from 1.04945 (10th April 2017) to 1.20924 (8th September 2017). The 38.2% level is around 1.1470.

In case the pair continues dropping we could see a deeper correction to 50% Fibo, which means a drop to around 1.1300 – 1.1290.

For now this is just a theory, the market will decide how deep the correction will be.

The scenario on the screenshot with the five impulse waves is just one of the possible scenarios, because this might not be the fourth wave and there might not be a fifth wave – there could be just waves developing in threes.


Wednesday, October 25, 2017

USD/CAD Broke Out Above The RSI Trend Line Twice

I decided to take another look at the USD/CAD pair since yesterday’s scenario for a drop to 1.2570 was invalidated.

Essentially what I wrote about an alternative scenario was exactly what happened.

The pair rallied a bit more and one could conclude that this is just deepening the RSI divergence, but my experience with divergences led me to conclude that should there be a breakout above the RSI trend line compared to the price trend line, we should rather expect a new rally.

While the pair is climbing the RSI trend line is moving further down, but there are now two breakouts above it on the H1 time frame. And that in turn means that this isn’t a case of the divergence deepening, but rather the pair is preparing to rally sharply.

Later today we are expecting the BOC to announce its interest rate, its monetary policy report and to hold a press conference. I think that during the news we will see such the CAD move sharply to the upside.

Let us wait and see how the pair will develop.


Tuesday, October 24, 2017

USD/CAD Could Fall To 1.2570


USD/CAD is in a resistance zone (1.2650 – 1.2670) on the daily time frame and it has not been able to break out above it for three days.


At the same time a divergence has appeared on the H1 time frame between three highs which is a hint that the pair could drop to 1.2570.


The Bollinger Bands indicator also signals for a possible drop, since there has been a breakout on the D1, H4 and H1 time frames and it is logical, considering the way this indicator works, for the pair to move back within the boundaries of the indicator before it continues moving north. Usually in such cases the correction continues to the breakout level of the indicator.

This scenario could be invalidated in case there is a breakout above the trend line of the divergence marked as a ray on the chart.


Monday, October 23, 2017

EUR/AUD Is Developing Withing A Wide Consolidation, A Breakout To The Downside Is Possible

EUR/AUD is developing in a rather wide consolidation, forming a figure on the D1 time frame which I interpret as a pennant.

On the same time frame we can notice that for the past eight days the pair has been forming small bars the bodies of which overlap and which have formed the barbed wire pattern.

From these technical analysis observations we can conclude that that in case of a breakout below the support trend line we could expect the pair to depreciate and its first target to the downside would be around 1.4700 – 1.4650. If it reaches the limit of the pennant too the drop could be around 750 pips.

In case there is a breakout to the upside, however, the first target would be around 1.5400-1.5450 followed by 1.5550.


Saturday, October 21, 2017

USD/CFH Is Resuming The Move North

Despite the beautifully formed pennant USD/CHF won’t depreciate – on the contrary, it will move north and at this stage there is little doubt about that.

The pair has been developing in a relatively tight consolidation (for such a large time frame like the monthly one) for three months between 0.944 and 0.974. In the meantime it managed to form three spinning top bars on the same time frame right above the support zone at 0.944-0.950.

These bars are an unambiguous signal that we will see a rally in the medium term. The first resistance level to the upside is around 0.9850, followed by 1.030 and above is the red resistance trend line, so the rally could reach 1.056 – 1.060.


Thursday, October 19, 2017

The Bullish EUR/USD Bars Were A Signal For A Rally

A strong bullish bar on the D1 time frame yesterday hinted that today we could see the EUR/USD move to the upside resume and that, indeed, happened.

Also, today another strong bullish bar formed on the H4 time frame after the beginning of the European session, which confirmed that expectation for a rally.


The first resistance should be around 1.18500-1.18700, but I expect the rally to continue at least until the pair reaches 1.1950, after which there will be a finished cycle of three corrective waves to the upside (the H4 chart) after the drop from 1.20924 to 1.16693.

In my opinion after the correction on the larger time frames (the one on the D1 time frame) is not over and after this rally I think there will be a new movement south to 1.1500, where is the zone of the 38.2% Fibo of the impulse rally from 1.05693 (10th April 2017) to 1.20924 (08th September 2017).


Wednesday, October 18, 2017

USD/JPY May Be Resuming The Upward Trend

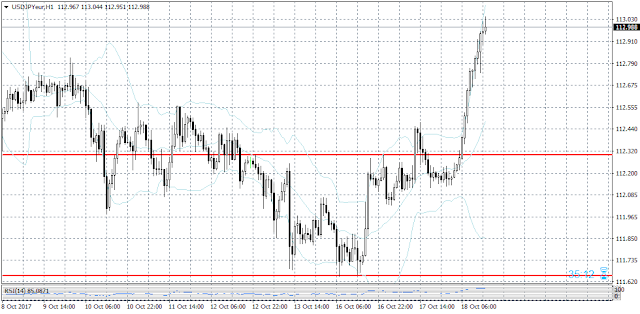
USD/JPY completely proved wrong my expectation for a drop, forming an inverted head and shoulders pattern on the H1 time frame, or, it could be said that there are clear support (considering the double bottom at 111.647 – 111.657) and resistance zones (112.299), which formed the horizontal channel the pair broke out above. After the second breakout today it became clear that the pair would reach the limit of the channel, which was 65 pips, and it has already done so.

On the D1 time frame, however, the strong resistance zone is around 113.10 – 113.30 and there we could expect a correction to the downside, before the pair tests the next resistance around 114.50 that can be seen on the W1 time frame.


In case it breaks out above 114.50, we could expect an acceleration of the upward movement to 119.00.

Tuesday, October 17, 2017

The ActivTrades Financial Trading Summit 2017


After organizing an incredibly successful Financial Trading Summit in London back in 2016, this year the leading online broker ActivTrades is organizing such a Summit in Dubai in the Shangri-La Dubai Hotel.

The Financial Trading Summit Progamme will be led by seasoned professionals and it will include:

-Applying Methods to Improve Trading Efficiency led by - Dr. Andrew Lumsden Groom
-Psychological Trading led by Ann Hunt
-Risk Management led by Sara Waqar
-An in-depth look into Fundamental Analysis led by Nour Eldeen Muffeed KH. Alhammoury
-A Panel Discussion

 The programme will also include lunch as well as a tea and coffee break.

The Financial Trading Summit will be held on 28th October 2017 at the Shangri-La Dubai Hotel,
Sheikh Zayed Road, Near Financial Metro Station, Dubai, United Arab Emirates. Participation is free of charge.
.
You can learn more details and register for The ActivTrades Financial Trading Summit here.>>>

Monday, October 16, 2017

There Is An Impending Rally To The Resistance At 112.65

The double bottom on the H1 time frame, the bullish RSI divergence on the same time frame and the strong support on the D1 time frame are the three strong signals for such a movement that cannot be overlooked.

 The two lows of the double bottom are at 111.650 and 111.659.

Regarding the second signal – there is a strong RSI divergence between three lows, which, if it reaches its limit, should lead the pair to 112.65. The resistance on the H4 time frame is also at that level, which makes this rally even more likely.

 However, we should keep in mind that such a rally will most likely be corrective and after it is over we could see a drop to the support in the zone around 111.00 – 110.50.

Saturday, October 14, 2017

Gold Rallied In A Perfectly Formed Channel


Gold reached the diagonal support at 1260.50 (in brown) for a second time and renewed its rally. At the same time it became possible to draw another diagonal trend line alongside the trend channel in which Gold has developed since 15th December 2016 (in red) and which essentially widened the trend channel.

I have marked the movements of the precious metal in the trend channel in blue. Logically speaking, I think that there will be a rally to the resistance trend line (in red), which will finish the cycle of three threes of waves within the channel. My main expectation is a rally to 1420.

In the alternate scenario it will reach the trend line marked by a red dotted line and ten fall to the brown trend line.

Of course, these are just the two main scenarios. There are other possibilities depending on the direction the market will pick.


Friday, October 13, 2017

GBP/USD Renewed Its Rally


After the drop from 1.3655 to 1.0268 the pair renewed its rally and at the moment it is at 1.3300 – 1.3320. That is a resistance level on the D1 time frame and it is possible the pair will have a difficulty breaking out above it.

Yesterday’s daily bar, however, is strongly bullish with a long lower shadow, which is a signal that the bulls have used the corrective drop to aggressively open long positions. If the tendency for a move to the upside remains we could expect that after a breakout of the resistance on the D1 time frame the pair will head to the trend line of the channel (in red) that it once broke out above and in the medium term it could break out above it again.

To the downside the pair could find a support in the zone around 1.3030 – 1.2980. If there is a breakout below that zone and it manages to remain below it we should watch for a renewal of the downward trend.


Thursday, October 12, 2017

USD/JPY Is About To Test 111.50


The zone around 112.200 – 112.000 proved to be a very strong support and USD/JPY has been struggling to break out below it for three days without much success.

In case the pair does break out below it I think we could expect it to reach the next support on its way down, which is around 111.50.

The market week will end soon and it is important to see how the W1 bar will close. My expectation is for some hesitation around 111.50 - 112.000 before the pair continues depreciating to 111.000 – 110.500.

The zone around 112,800 - 113.000 is critical to the upside.

Wednesday, October 11, 2017

The EUR/USD Correction Continues Developing


EUR/USD reached exactly 23.6% (1.16693) Fibo of the impulse rally from 22nd February 2017 to 8th September 2017 and, as it could have been expected, began a slight move north.

I expect that the current move north will continue in the following days to 1.1970 – 1.2000.
In my opinion, however, the last local low (1.1669) is not the end of the correction and I expect a further corrective drop to 38.2% Fibo (1.1500 – 1.14750).

Of course, the 3-wave correction shown on the chart is just one of the possible scenarios, while the correction for the supposed fourth wave could be much more complex.

There is an alternate scenario where the pair could reach a new high, but I think that for the moment that scenario is less probable.


Monday, October 09, 2017

The Forex Calendar For This Week


Although the announcement of the US Change in Non-Farm Payrolls was last week, that is hardly the only high impact event that has a considerable effect on the market. This week there are also several important events traders should be aware of while they trade:

Monday is free of events, but on Tuesday we can expect the British Manufacturing Production m/m.

On Wednesday will be announced the FOMC meeting minutes.

On Thursday will be announced the US Producer Price Index m/m and Unemployment Claims, the ECB President Mario Draghi will speak, and after that will be the US Crude Oil Inventories.

On Friday we can expect the US Consumer Price Index m/m, the Core Consumer Price Index m/m, the Core Retail Sales m/m and the Retail Sales m/m.